4. Wireshark Essentials
Wireshark,1 previously known as Ethereal,2 is the de-facto packet analysis tool. Wireshark can dissect a large number of common protocols, including Ethernet, IP, TCP, UDP, and 802.11, and more esoteric ones including ATM3 and EtherCAT.4 It handles live capture on different mediums, can open or save data in a number of capture formats, and allows us to do analysis and data graphing. The display and capture filters allow us to narrow down the amount of data displayed and received, which often comes in handy.
Last but not least, Wireshark is available on a wide variety of operating systems as a GUI and as a command line tool called TShark.5 Wireshark includes other command line tools including dumpcap,6 which handles packet capture but doesn't do any dissection, and SSHdump, which simplifies remote packet capture via SSH. A number of other utilities are also provided.
In this module, we'll explore Wi-Fi-specific Wireshark features.
1 (Wireshark Foundation, 2021), https://www.wireshark.org/ ↩︎
2 (Linux.com, 2006), https://www.linux.com/news/ethereal-changes-name-wireshark ↩︎
3 (Wikipedia, 2021), https://en.wikipedia.org/wiki/Asynchronous_transfer_mode ↩︎
4 (Wikipedia, 2021), https://en.wikipedia.org/wiki/EtherCAT ↩︎
5 (Wireshark Foundation, 2021), https://www.wireshark.org/docs/man-pages/tshark.html ↩︎
6 (Wireshark Foundation, 2021), https://www.wireshark.org/docs/man-pages/dumpcap.html ↩︎
4.1. Getting Started
To begin, let's explore the Wireshark GUI and discuss various features and settings. Wireshark will capture Ethernet packets by default, even when we are using a wireless interface. In order to collect only raw wireless frames, the Wi-Fi adapter must be put in monitor mode prior to launching Wireshark.
kali@kali:~$ sudo ip link set wlan0 down

kali@kali:~$ sudo iwconfig wlan0 mode monitor

kali@kali:~$ sudo ip link set wlan0 up
Listing 1 - Monitor mode commands
4.1.1. Welcome Screen
When launched, Wireshark presents a screen like the one in Figure 1 below.
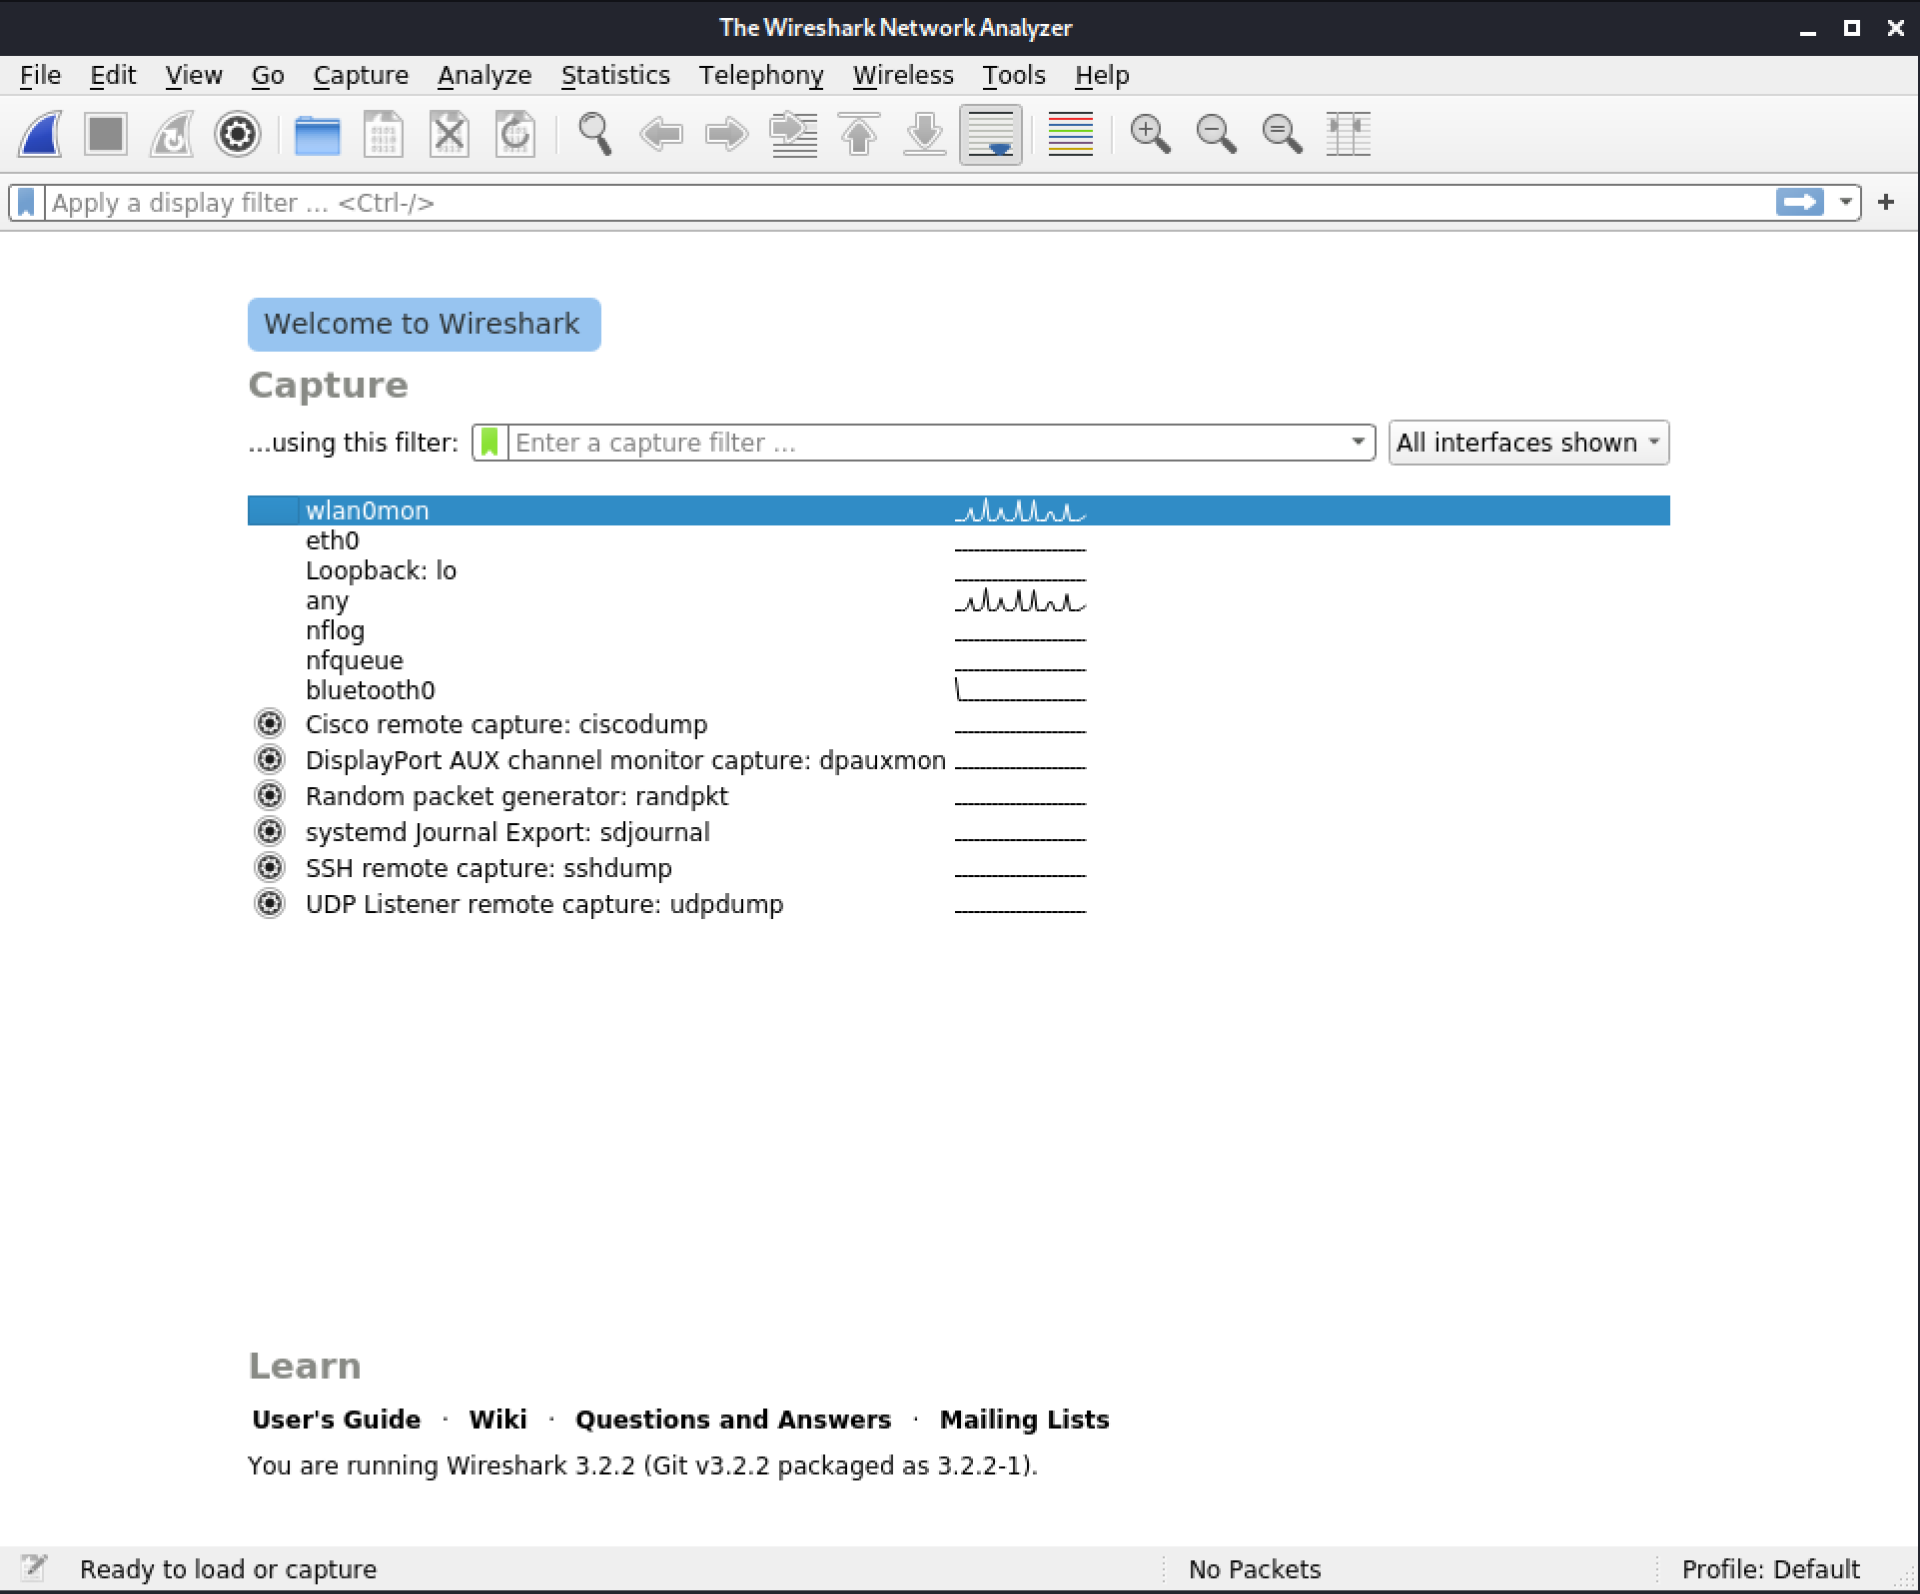
Figure 1: Wireshark startup screen
This screen displays the Display Filter, recently opened files, the Capture Filter setup, the list of interfaces, the traffic sparklines, and other relevant information. The sparklines show network activity on each of the interfaces and they go up and down depending on the amount of traffic. Wireshark refreshes the interfaces list as they are removed or added, but it doesn't show ones that are down.
To the right of the capture filter textbox there is a dropdown that displays the different types of interfaces available. Checking and unchecking will show or hide certain interfaces based on their type. We will select Wireless in order to focus on wireless only.
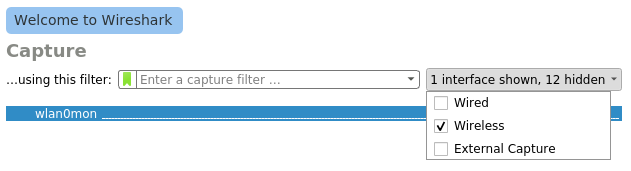
Figure 2: Interface types selector
The options shown in Figure 2 are dynamic and depend on what is available on the current system. If there are no wireless interfaces, the Wireless option will not be present. We might see other categories such as USB for USB devices, Bluetooth for Bluetooth devices, and Virtual for interfaces related to virtualization software.
After closing the interface type selector, the list of interfaces below the capture filter textbox will update. In this case, because only Wireless is selected, only the wlan0mon interface remains.
There are two ways to start the capture. We can either double-click on the interface, or we can select the interface and then click on the shark fin right below the File menu. The shark fin will turn blue once we choose an interface.
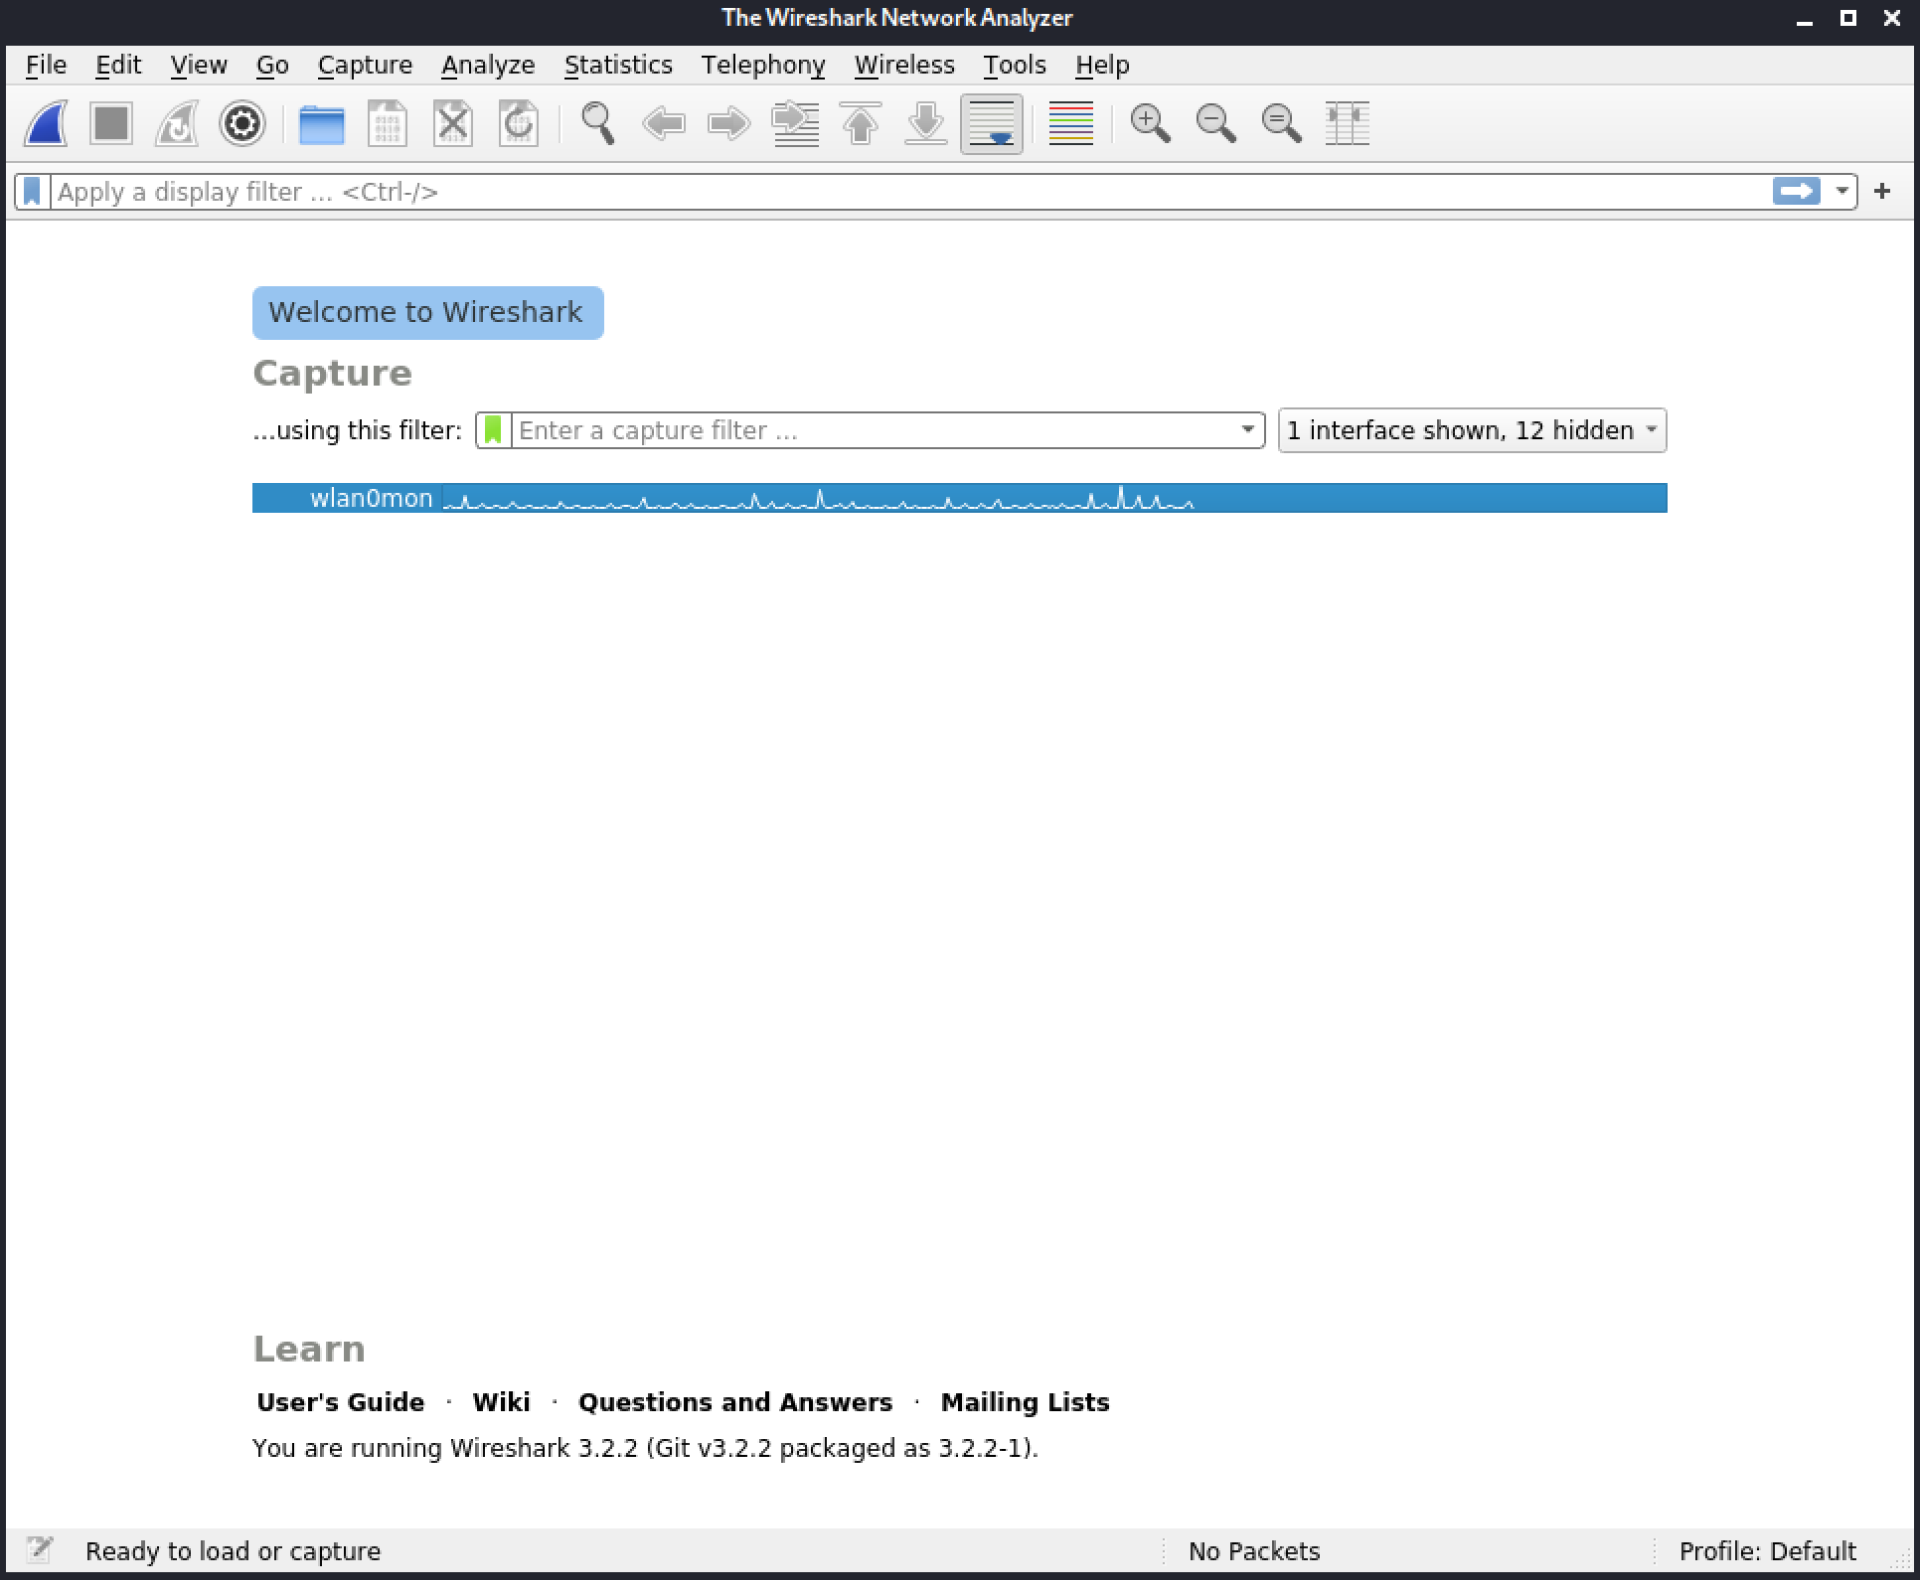
Figure 3: Interface types selector
4.1.2. Packet Display
Once we start the capture, packets begin appearing in our display. We can see the Wireshark window arranged into three frames.
- Packet List contains a list of all captured packets with details in customizable columns containing information such as source, destination, protocol, etc.
- Packet Details contains dissected details of the currently selected packet.
- Packet Bytes contains the hexadecimal representation of the actual bytes of the packet. When an item is selected in Packet Details, the corresponding bytes are highlighted in this field.
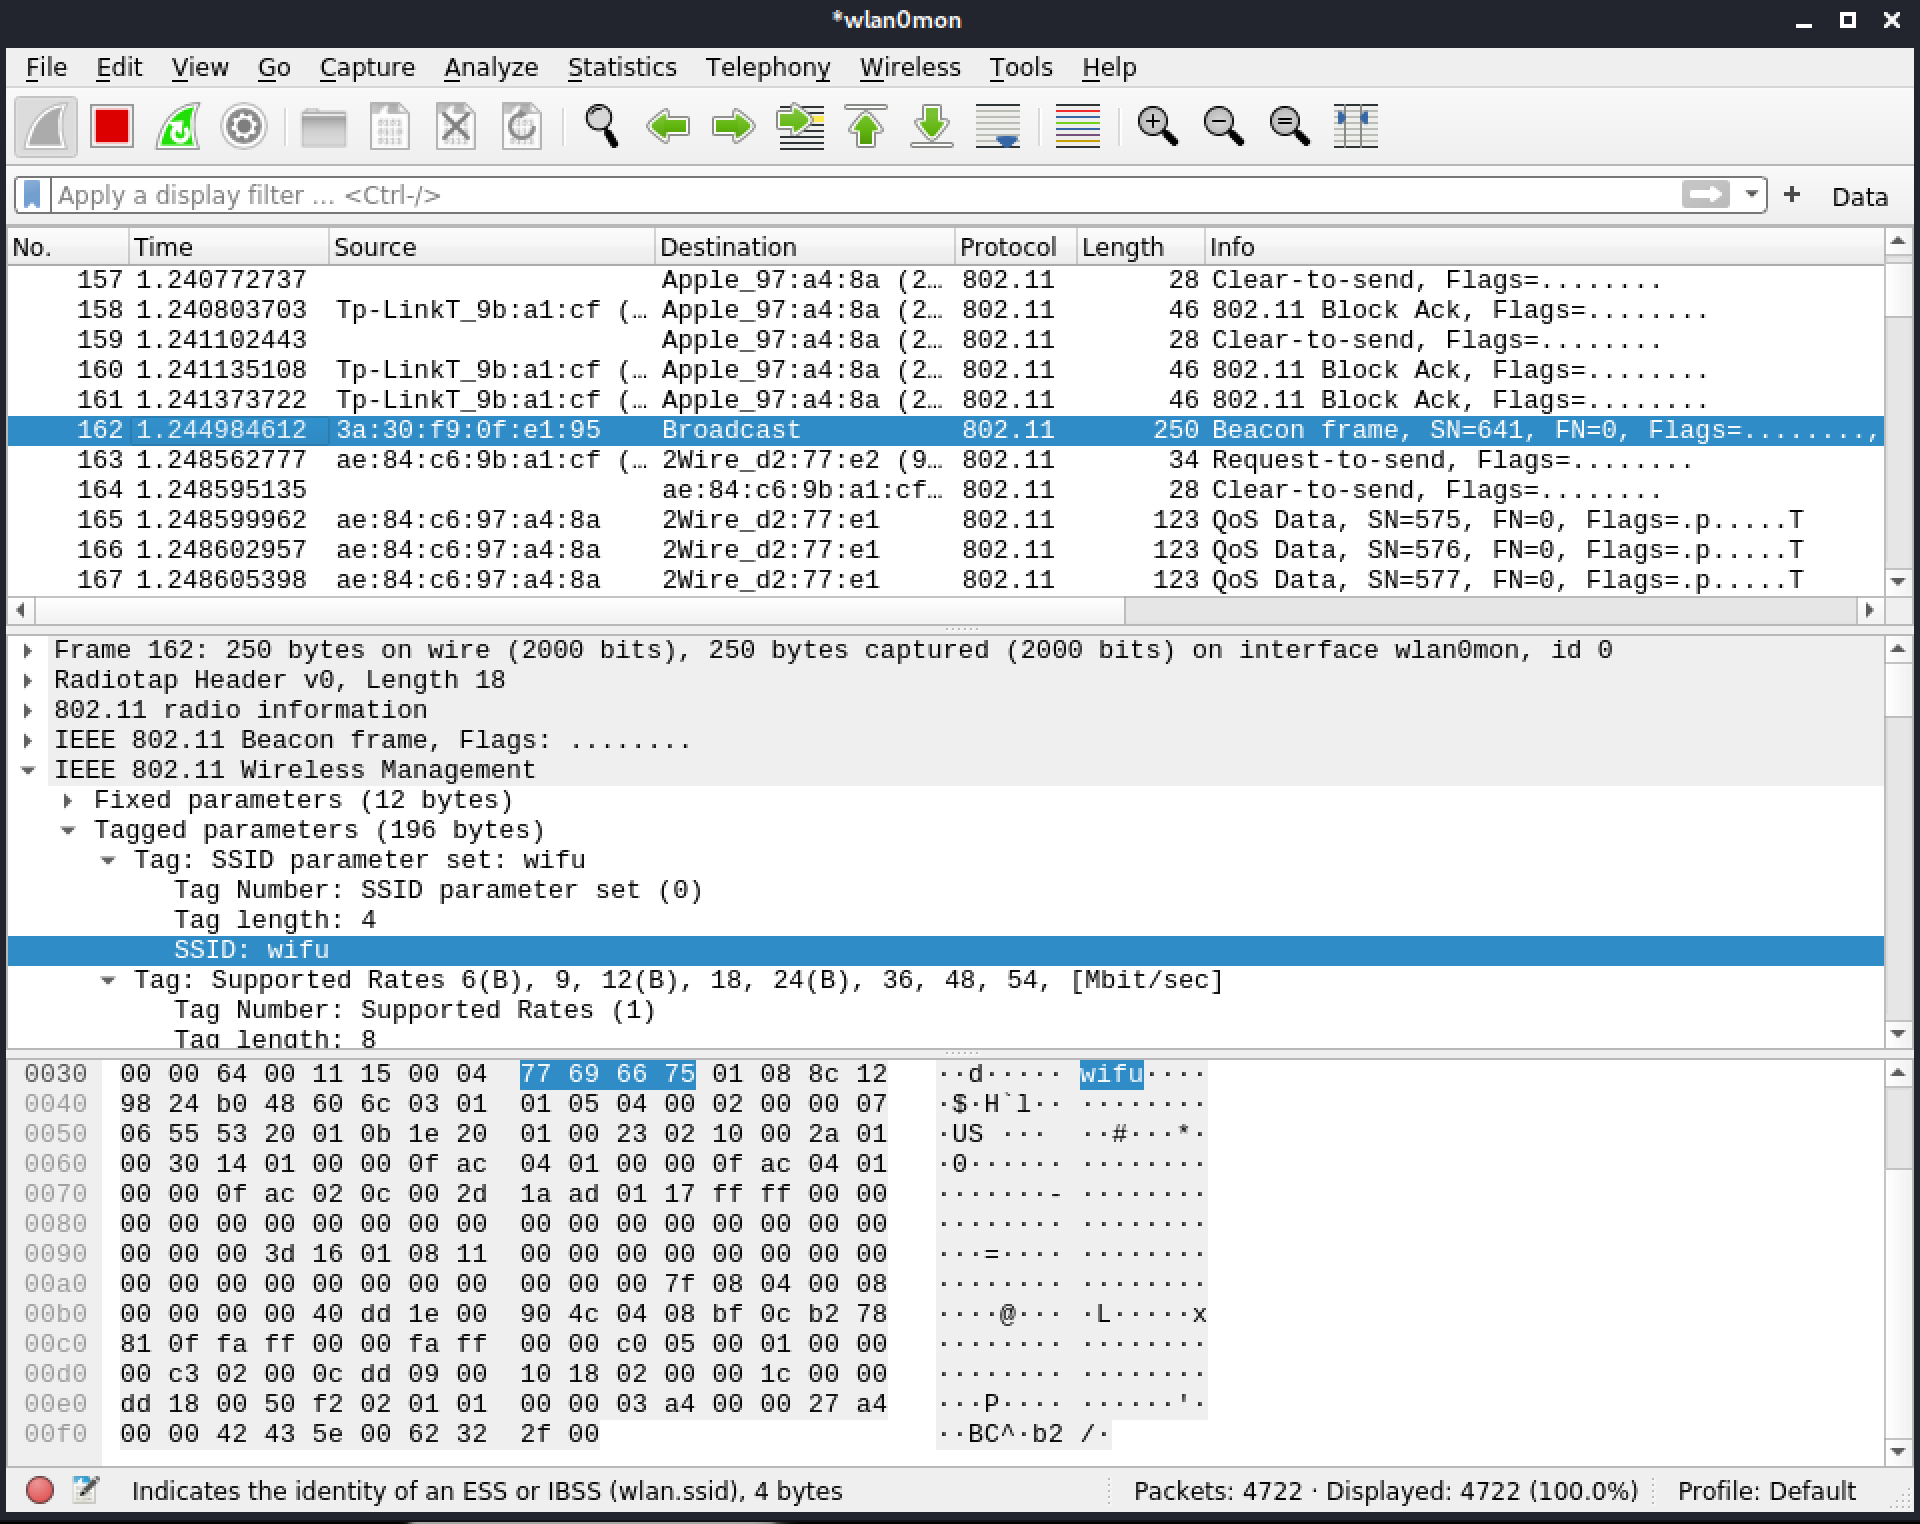
Figure 4: Capturing - Packet list
In the upper left of our display, the toolbar now has the Start Capture button greyed out. The red Stop Capture button and the green Restart Capture button are now active.
The packet list layout can be rearranged in various ways. Let's select Edit > Preferences > Appearance > Layout to choose another arrangement.
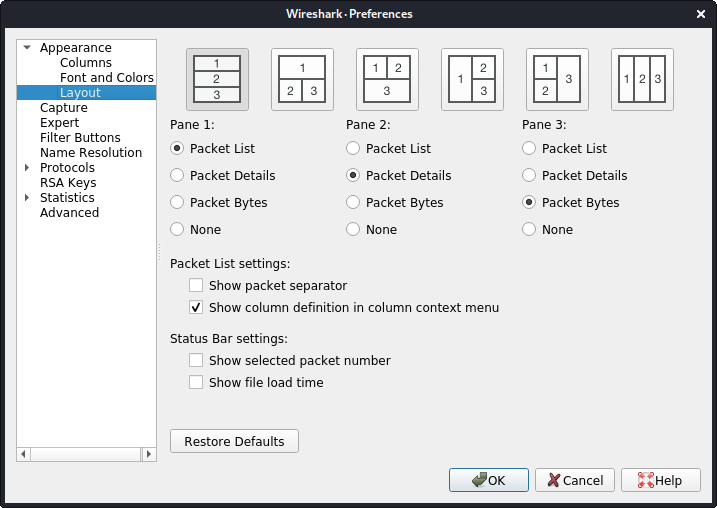
Figure 5: Capturing - Packet list layout
We can change the layout, order, or disable panes if desired. We will select the second layout, which places the Packet Details and Packet Bytes side by side. This will be helpful when examining the content of the frames.
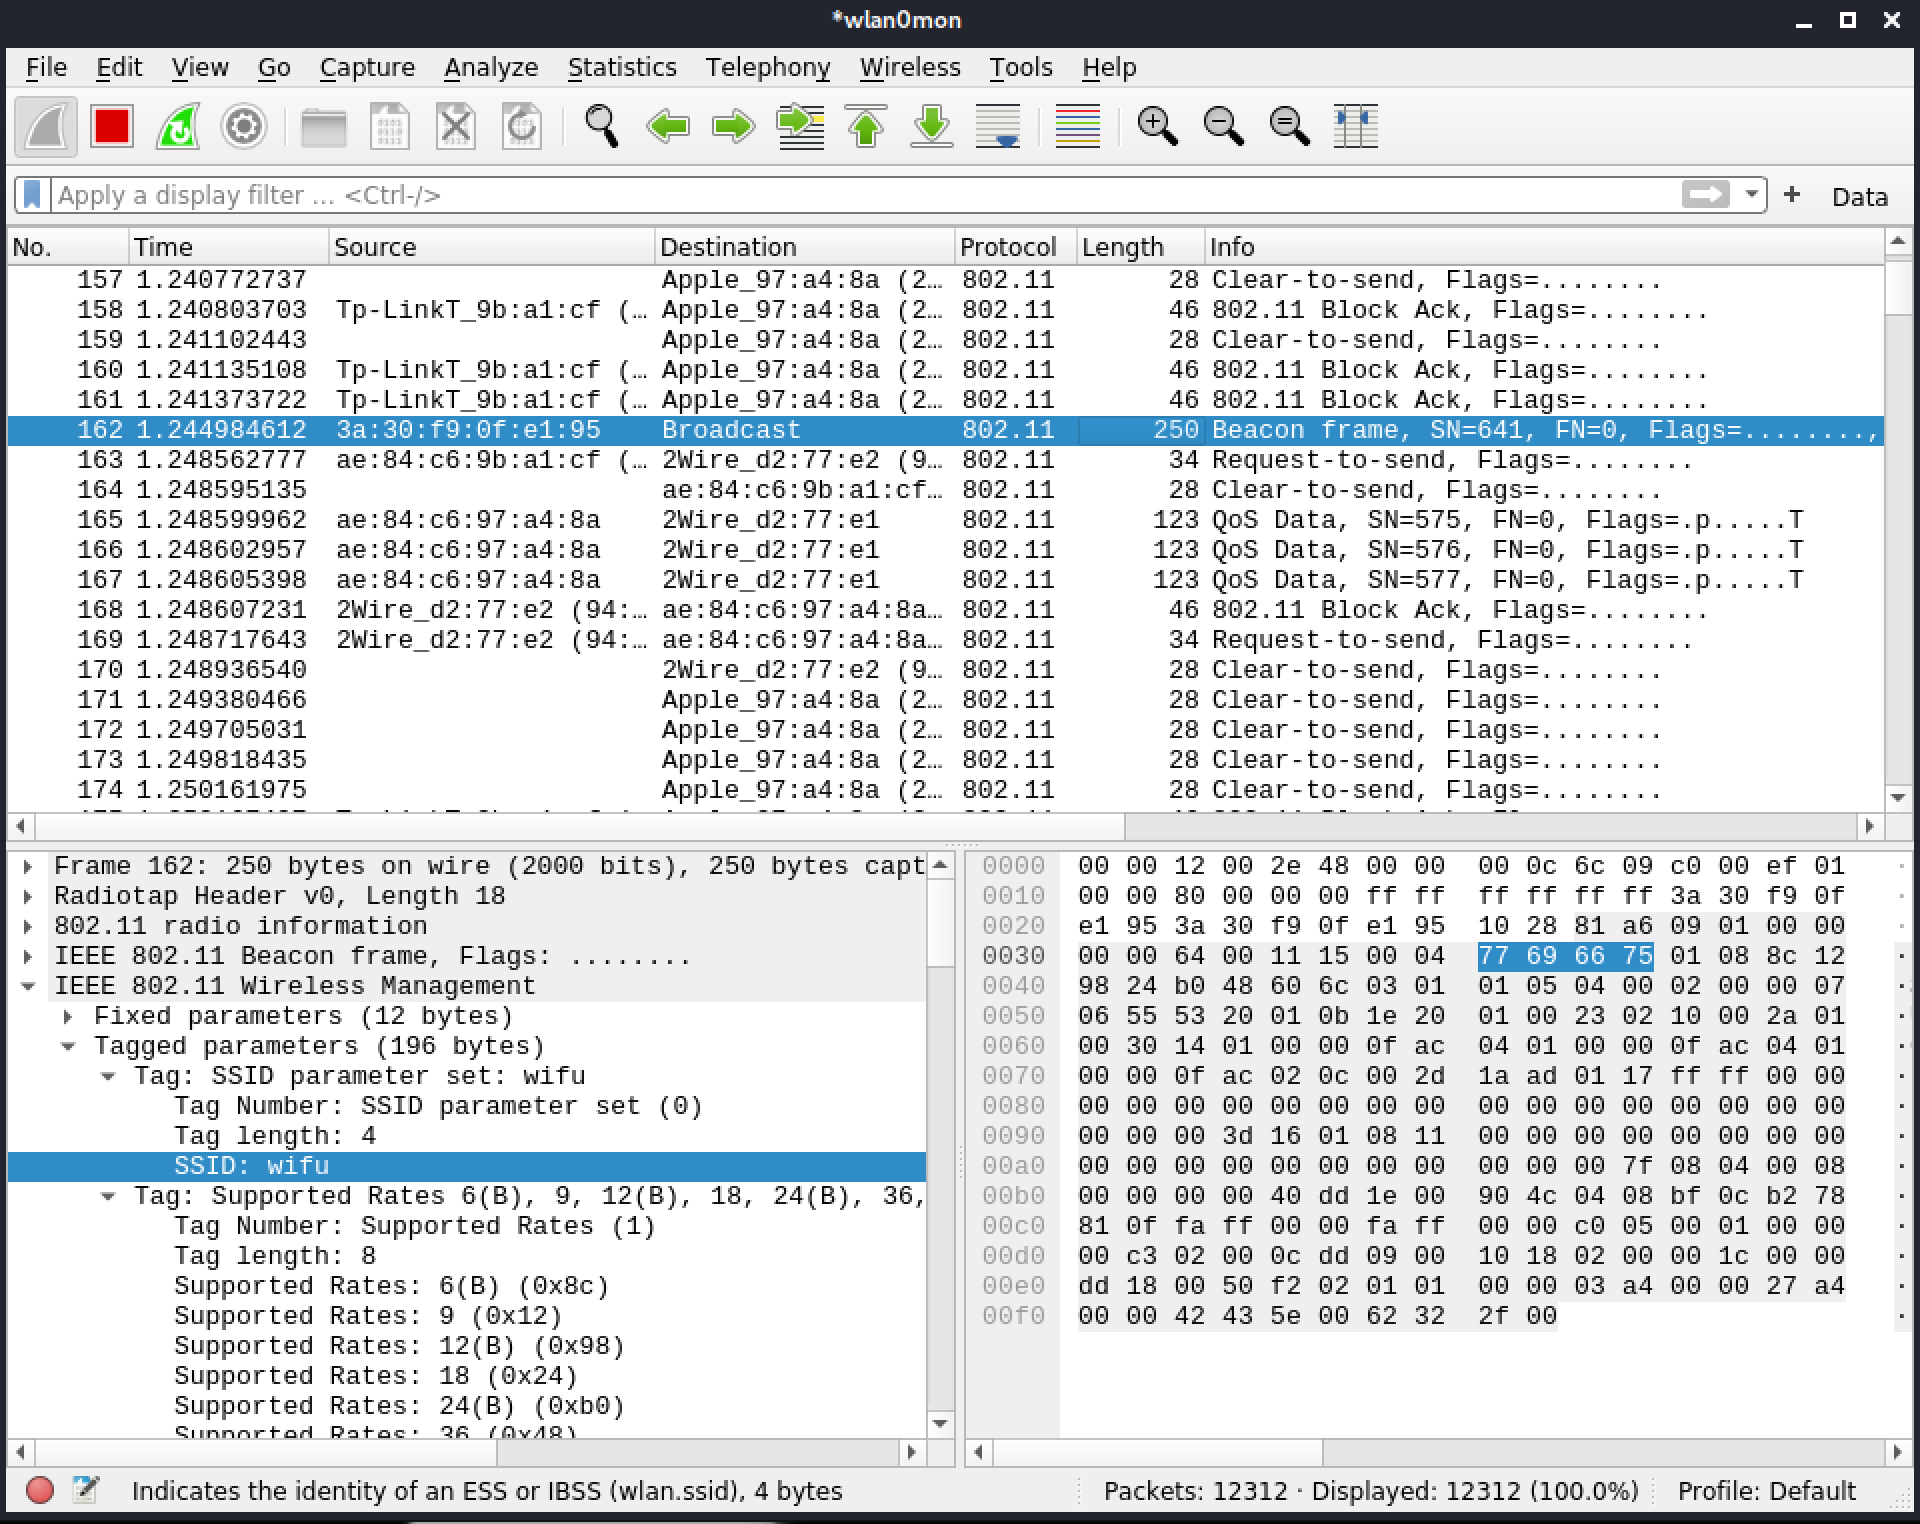
Figure 6: Capturing - Packet list layout option
4.1.3. Wireless Toolbar
The Wireshark wireless toolbar will allow us to change channels manually as well as set the channel width. This toolbar is disabled by default but can be enabled by checking View > Wireless Toolbar.

Figure 7: Wireless toolbar checkbox
Once selected, the toolbar gets added below the display filter toolbar.
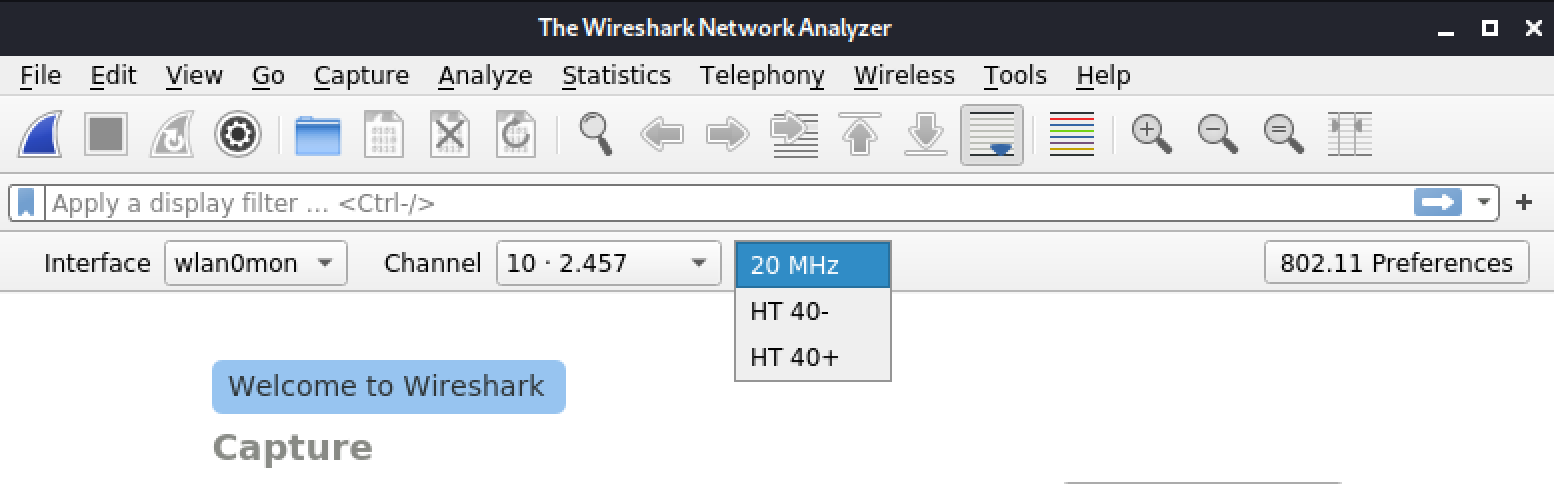
Figure 8: Wireless toolbar checkbox
The 802.11 Preferences button, at the far right of the toolbar, is a shortcut to the 802.11 protocol preferences, which contains various 802.11 settings. We'll go over these later in this module.
Wireshark doesn't channel hop.1 It will stay on whatever channel the wireless adapter is currently on. To quickly scan all channels on 2.4GHz, we can run the following shell script in the background in a terminal.
for channel in 1 6 11 2 7 10 3 8 4 9 5
do
  iw dev wlan0mon set channel ${channel}
  sleep 1
done
Listing 2 - Wireshark simple channel hopping script
We could also use airodump-ng2 to do channel hopping. Airodump-ng is meant to be a full-blown tool to capture wireless frames and has a handy default behavior of channel hopping without saving any data. Running sudo airodump-ng wlan0mon will achieve a result similar to the shell script above.
1 (The Free Dictionary, 2021), https://idioms.thefreedictionary.com/channel+hopping ↩︎
2 (Aircrack-ng, 2020), https://aircrack-ng.org/doku.php?id=airodump-ng ↩︎
4.1.4. Saving and Exporting Packets
After doing a packet capture, we can save the whole contents of the packet list into a file use File > Save or File > Save As.... The most common format is PCAP.1 The capture file may be compressed with GZIP to save disk space.
Two of the less common formats, such as PCAPng2 and nanosecond PCAP, can both be accurate to the nanosecond. They are a thousand times more precise than PCAP, which uses microsecond precision. Having said this, the regular PCAP format works just fine for most scenarios and it also has excellent compatibility with other tools handling packet captures.
Wireshark offers the ability to filter what is saved to a file. We can edit this using the File > Export Specified Packets... option.
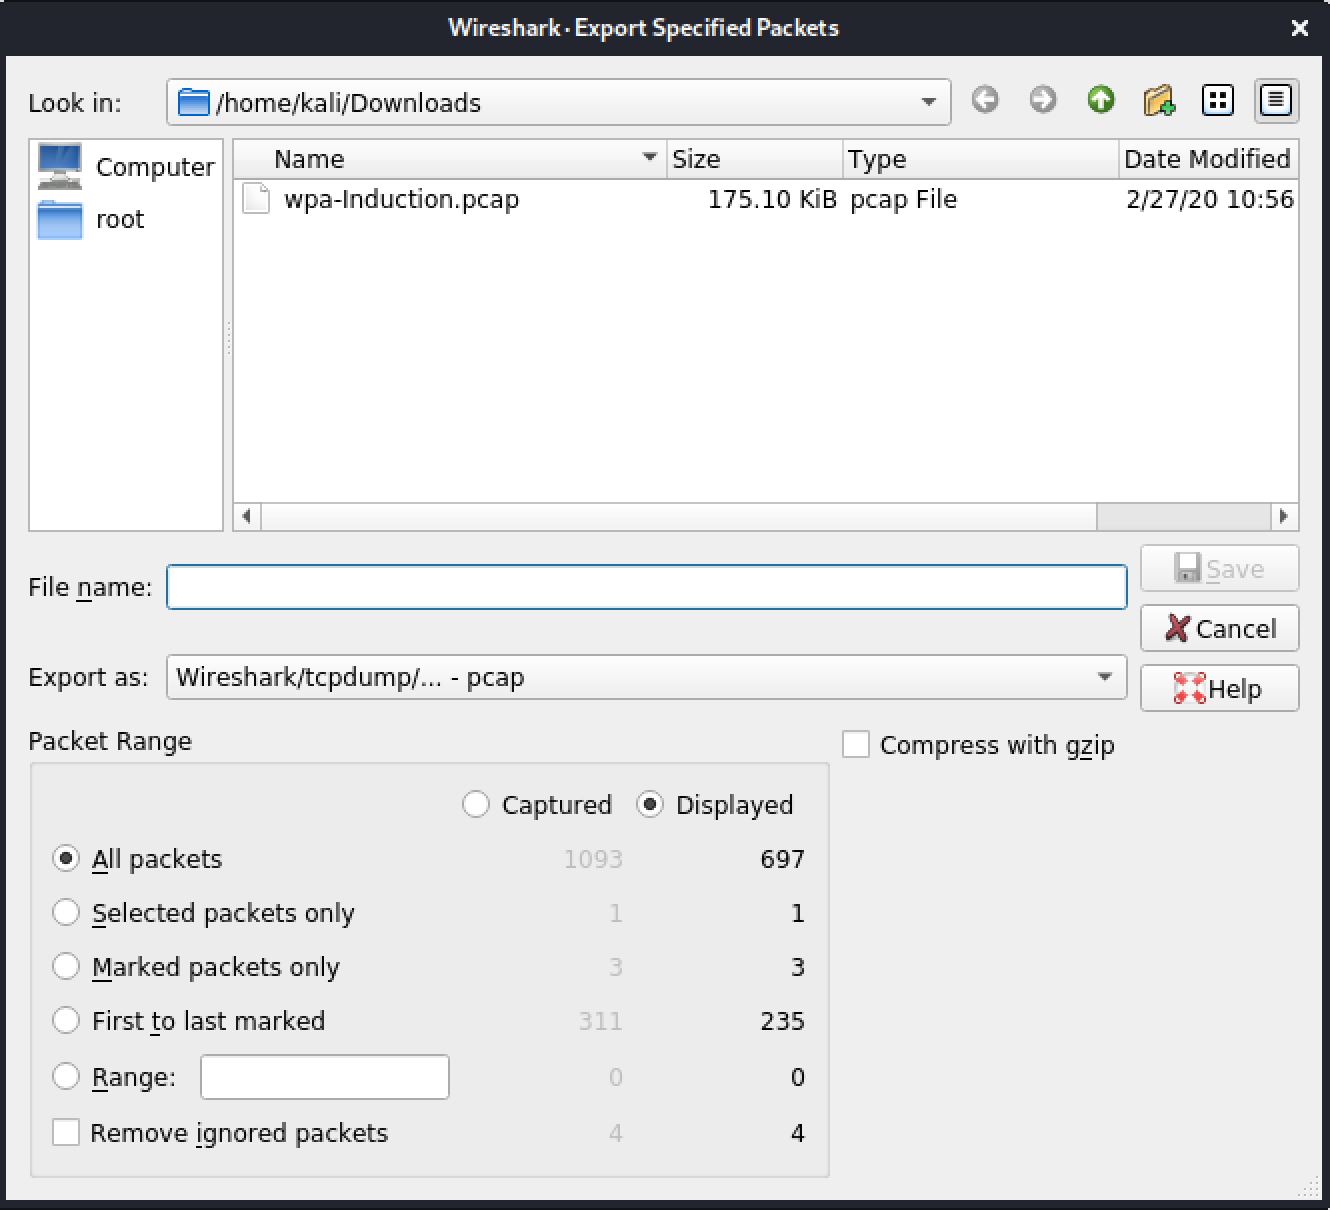
Figure 9: Export specified packets
This is similar to Save and Save as... but with a number of options shown in the lower left box. Selecting Displayed saves only those packets shown as a result of a currently applied filter. Captured saves all the packets.
We can further refine the choice of packets using radio buttons.
- All packets is the default option
- Selected packets only saves one or multiple packets selected with the B key.
- Marked packets only includes packets marked in the packet list by right-clicking and selecting Mark/Unmark Packet.
- First to last marked saves all packets between the first and last marked packets.
- Range includes packets that have packet numbers landing in a particular range (for example, packets 5-10).
- Remove ignored packets will exclude ignored packets. To ignore a packet, we right click on it and select Ignore/Unignore Packet.
Exercises
- Plug in your wireless card and enable monitor mode.
- Open Wireshark and start capturing frames.
- Enable the wireless toolbar and switch between channels 1, 6, and 11.
- Save the capture file for later use.
1 (Wireshark Foundation, 2015), https://wiki.wireshark.org/Development/LibpcapFileFormat ↩︎
2 (M. Tuexen, et al, 2021), https://datatracker.ietf.org/doc/html/draft-tuexen-opsawg-pcapng-02 ↩︎
4.2. Wireshark Filters
As we will discover, a packet capture consists of collecting a lot of data. Filters allow us to cut down on the amount of data we have to wade through so that we deal with only what is necessary or relevant. Wireshark uses two types of filters in order to limit what needs to be analyzed, display filters, which limit the packets that are displayed, and capture filters, which limit the amount of data captured.
4.2.1. Wireshark Display Filters
Display filters1 affect which packets are visible in Wireshark's packet list. These filters impact what is displayed only, meaning that Wireshark may be capturing additional packets that are not visible.
Display filters are applied and edited in the Filter toolbar located between the Main toolbar and the packet list.

Figure 10: Packet list columns
We will use display filters in a few different features in order to customize Wireshark and make our work easier.
Display Filter Expression
The best way to understand the syntax of Wireshark display filters is to create one with the Display Filter Expression screen. Let's select Analyze > Display Filter Expression... to open the screen with all the available filters.
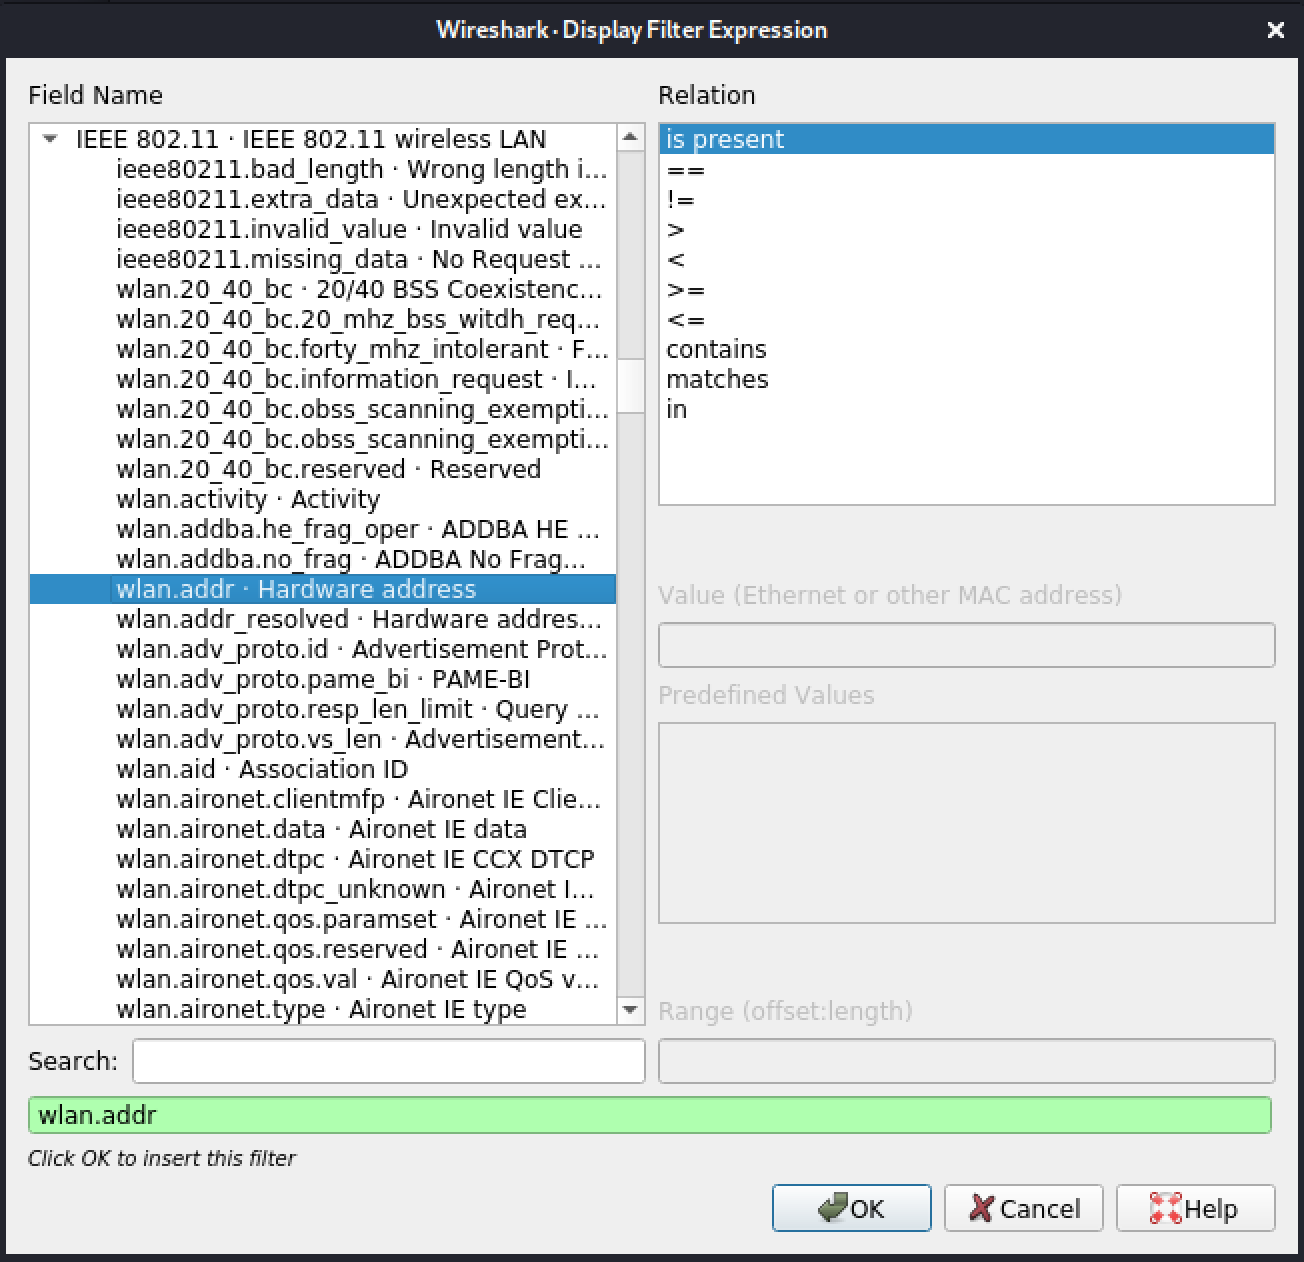
Figure 11: Display Filter Expression builder
Each display filter has a field name and relation, as well as a value, if applicable. The textbox highlighted in green is where the filter expression is displayed.
We can think of the field as an object with one or more items. The field can be built using dot-notation. This is similar to what we would see in object-oriented programming languages. The Field Name displays the object and a short description.
Hovering the mouse in the Relation window displays a pop-up that provides more details.
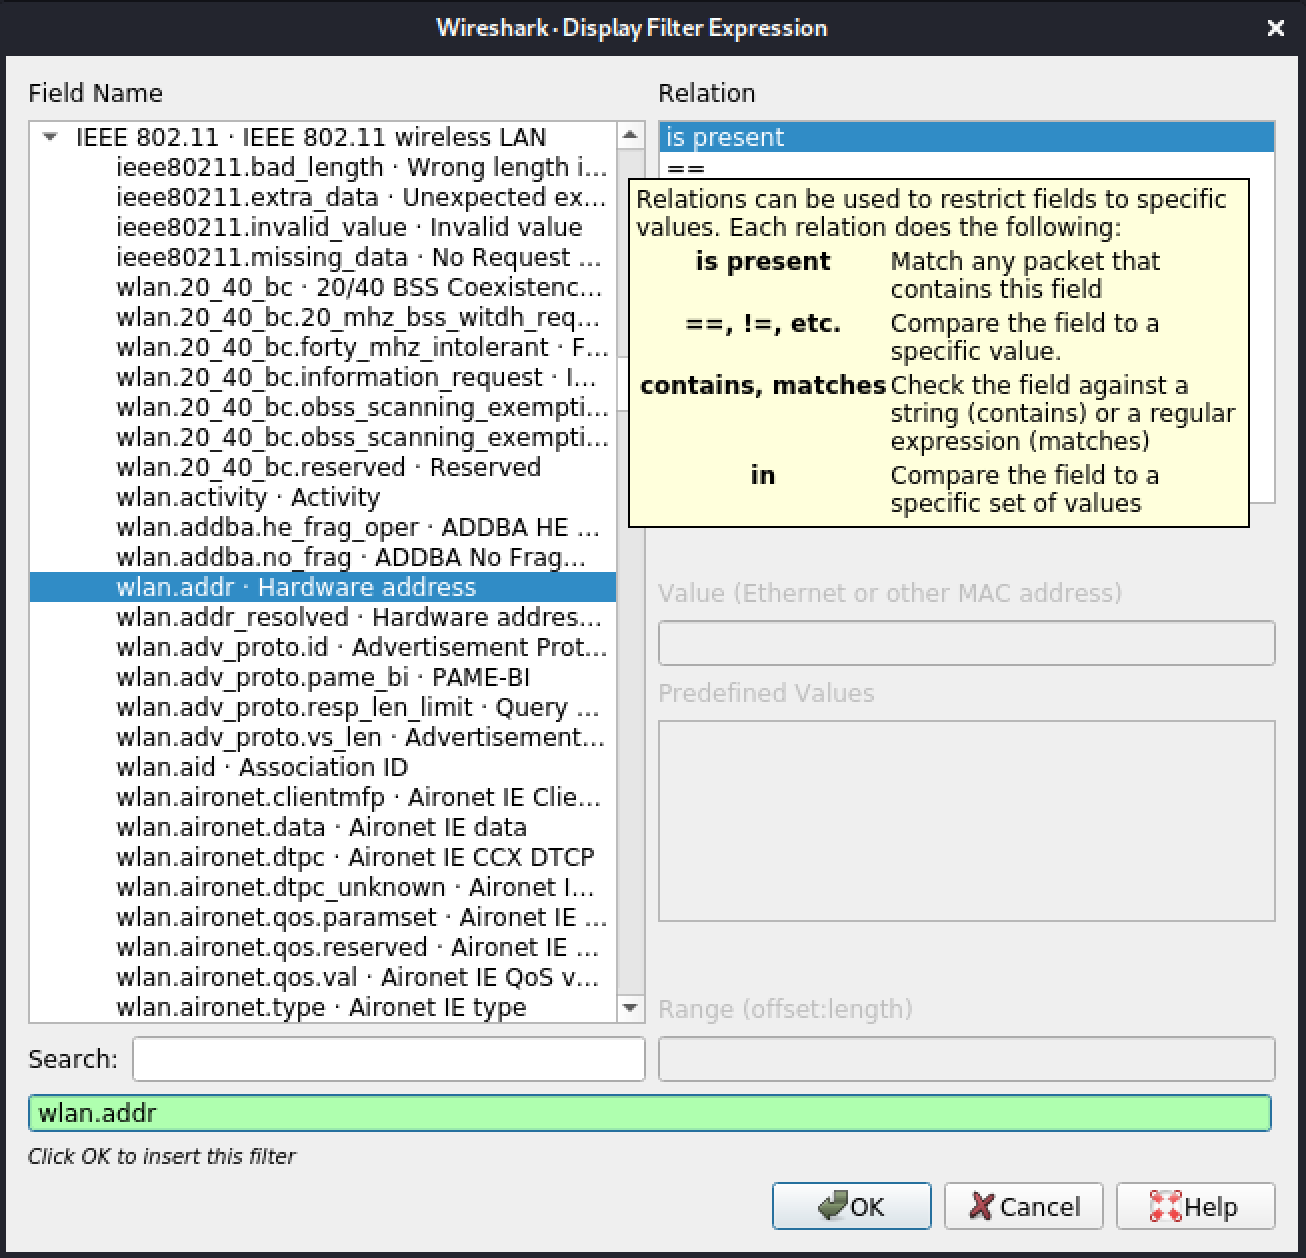
Figure 12: Display Filter Expression builder - Relation explanations
A display filter expression's relation can be one of the following: is present, ==, !=, <, >, >=, <=, contains, matches, or in. Depending on the field selected, not all relations will be available.
The Search field, located below the Field Name list, is useful when we can't remember a specific filter. It will narrow down the list of field names as we type, and it shows matching results from both the names and their descriptions.
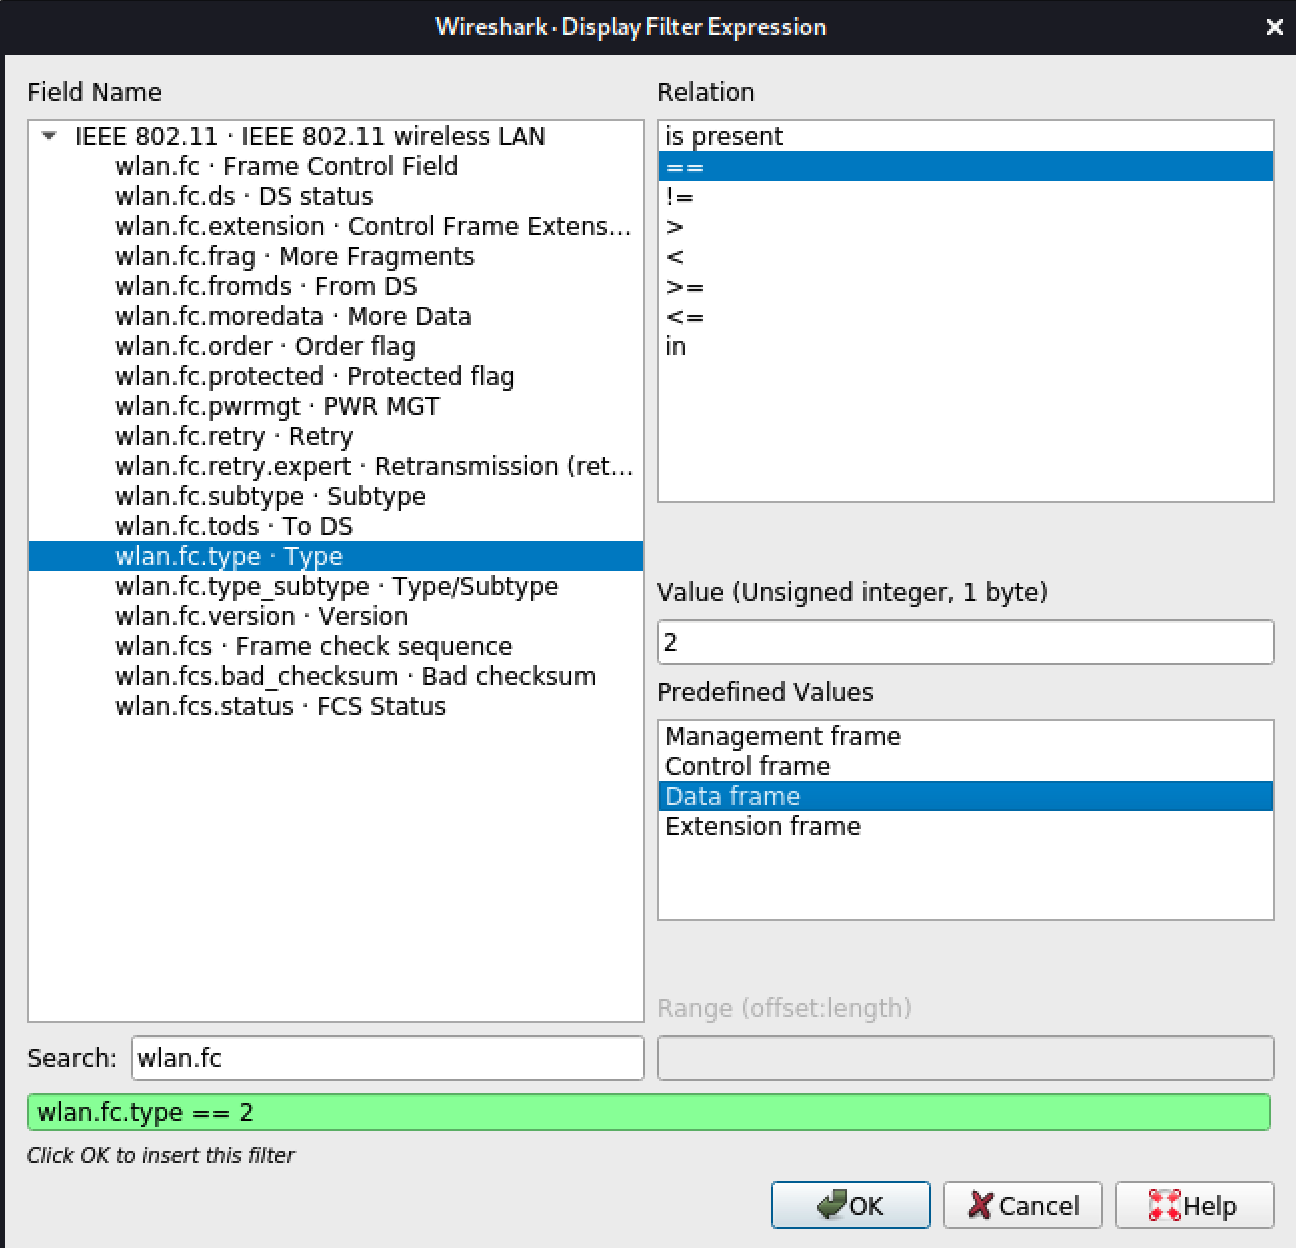
Figure 13: Display Filter Expression builder - Searching for 'wlan.fc'
The Predefined Values window contains a number of options that relate to different byte values in certain packet fields. For example, wlan.fc.type can have four different values: 0, 1, 2, and 3. These relate to Management, Control, Data, and Extension frames, respectively. Our chosen "wlan.fc.type == 2" filter in Figure 13 has "byte value 2", which filters for data frames.
Clicking OK updates the contents of the display filter toolbar with our selected filter and the resultant packets as shown in Figure 14.
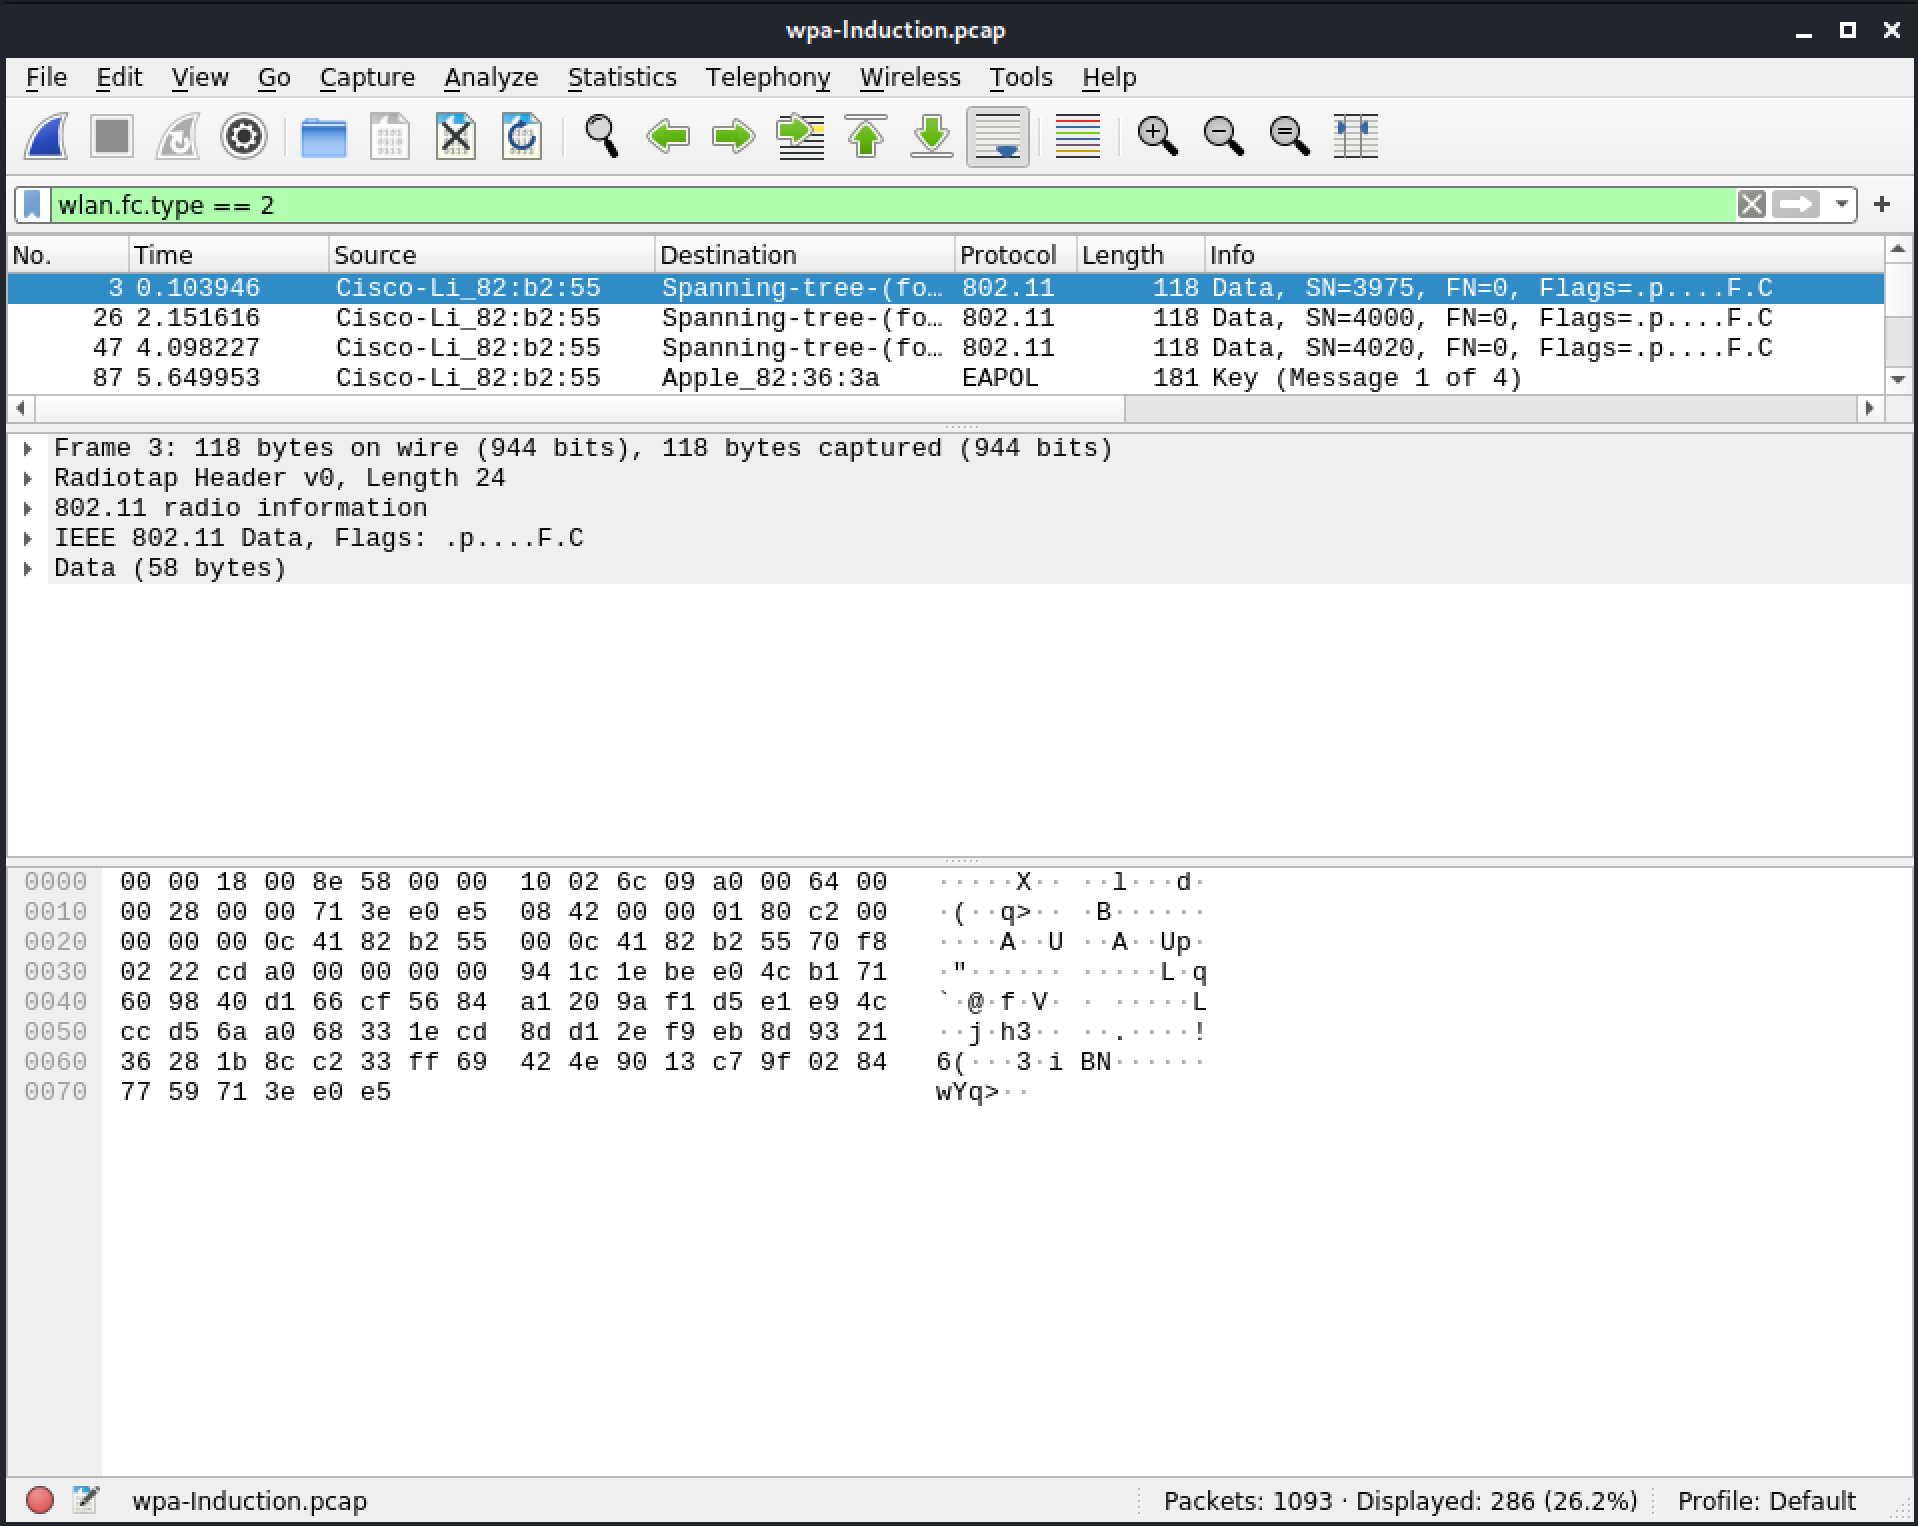
Figure 14: Display Filter Expression builder - Applied filter 'wlan.fc.type == 2'
Packet Details
We can also build filters based on items from a selected packet. Let's illustrate this by creating a data frame packet filter. We will start by selecting a data packet from the packet list.
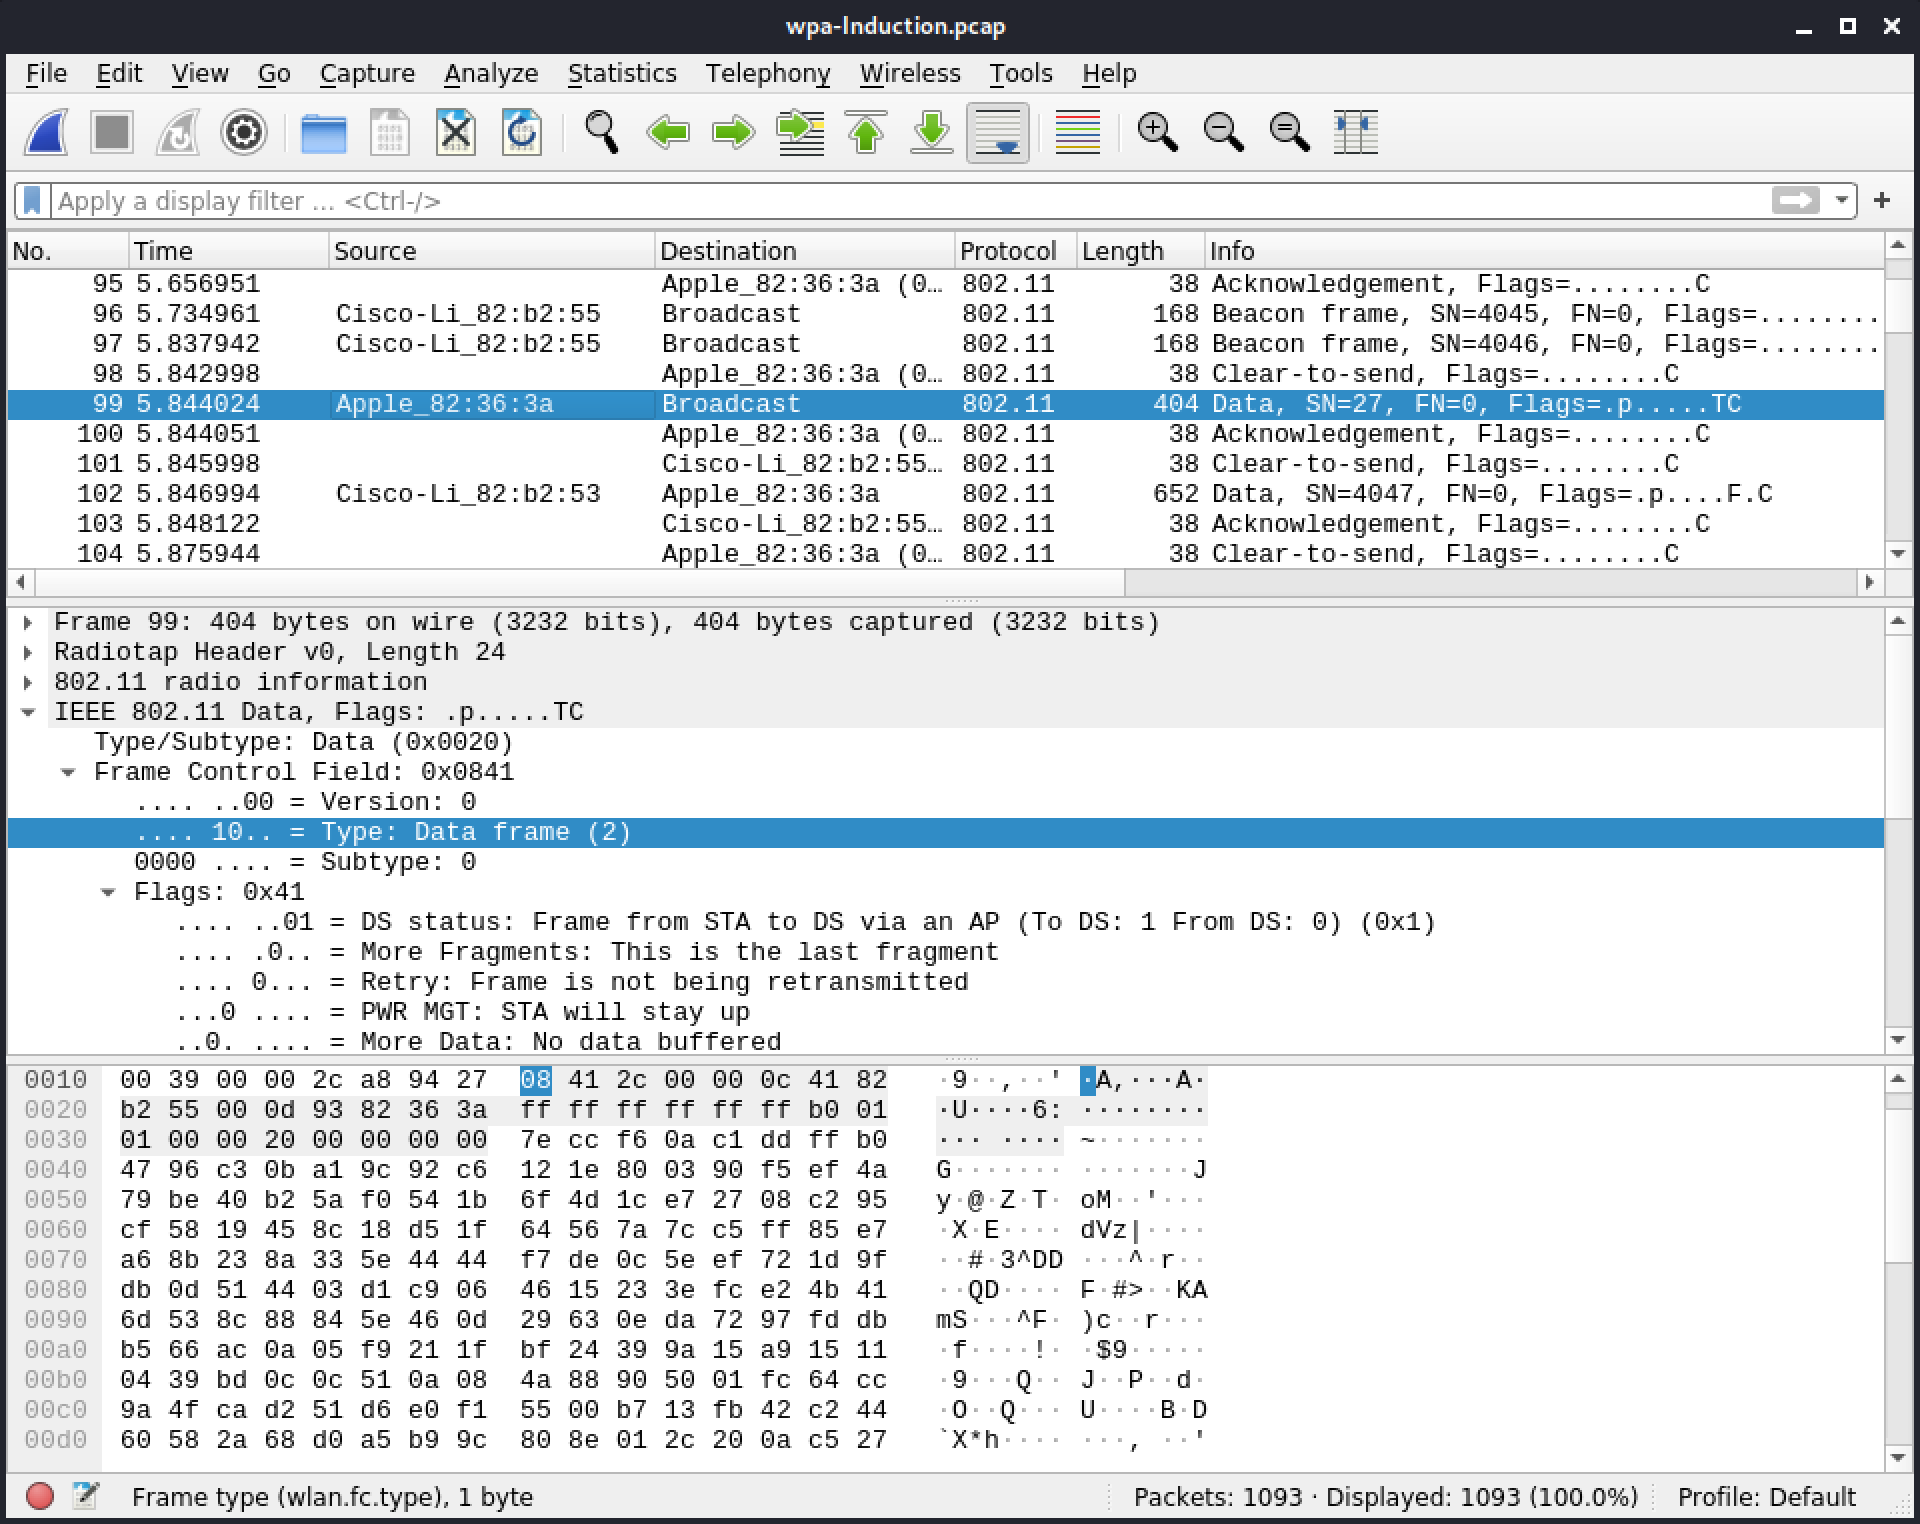
Figure 15: Display Filter Expression builder - Data frame
In the packet's detail window, let's expand the IEEE 802.11 Data, Flags field and the Frame Control Field and then right click the Type: Data frame (2) element. Finally, we'll select Apply as Filter (selecting Analyze in the Main toolbar also displays these options).
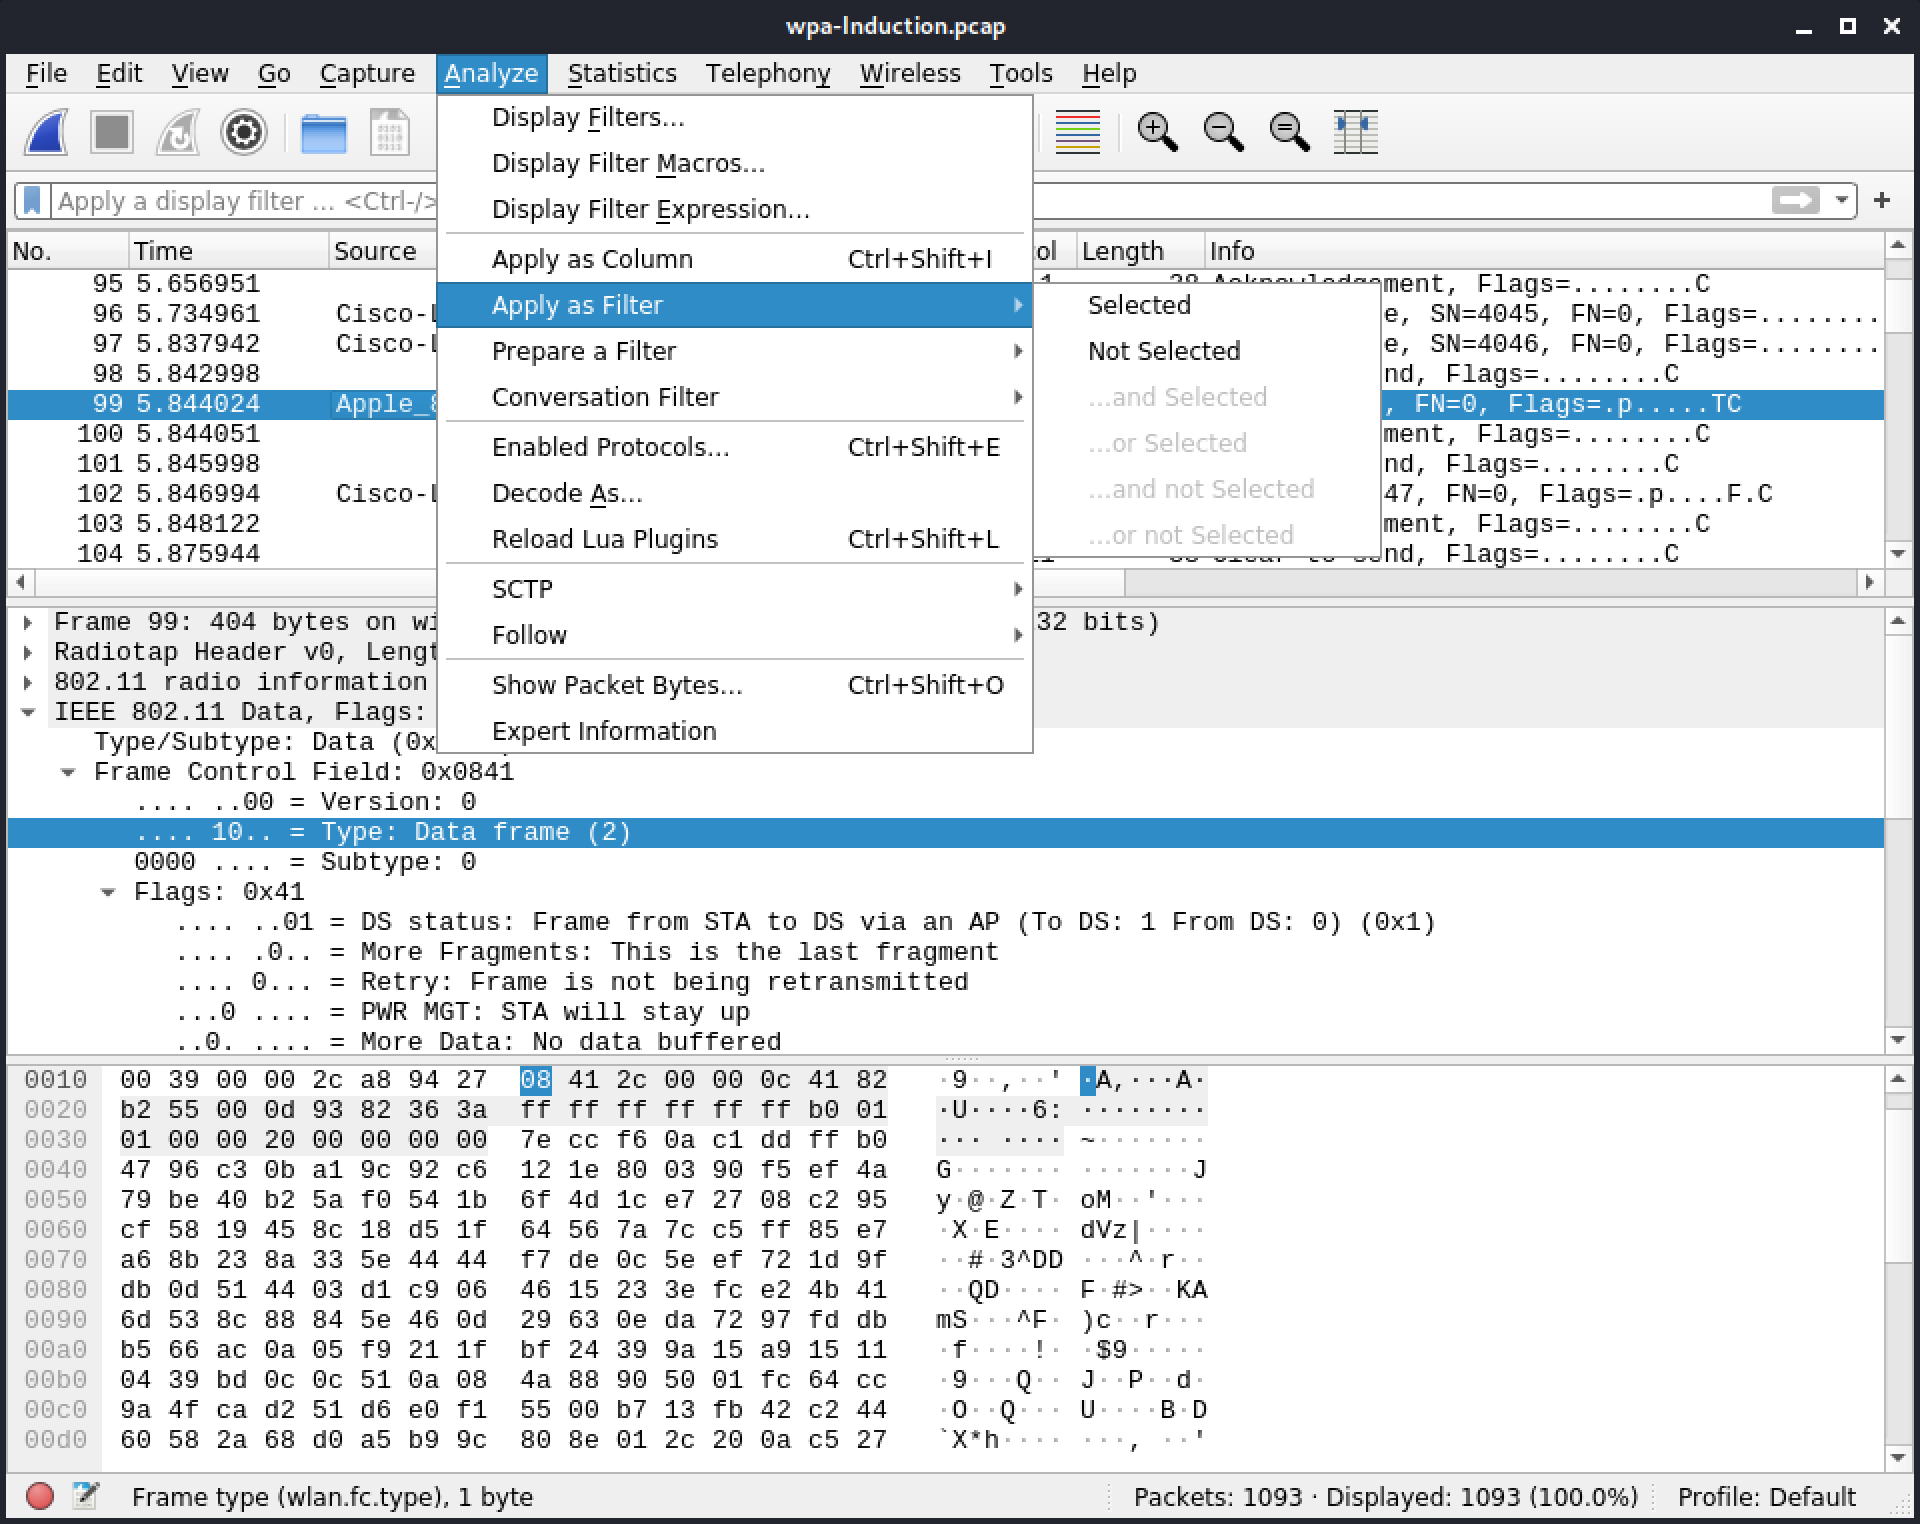
Figure 16: Apply as Filter submenu
Now we have a number of options to choose from.
- Selected clears the display filter bar of any existing queries and generates a new query to search for this specific value. For example, wlan.fc.type with a value of "2" generates "wlan.fc.type == 2" in the display filter bar.
- ... and Selected appends to any existing query by using an AND (&&) condition. Taking the query we created above and adding a wlan.fc.subtype value of "0" generates "(wlan.fc.type == 2) && (wlan.fc.subtype== 0)" in the display filter bar.
- ... or Selected does the same as the above filter but instead of using an AND, it uses an OR (||) condition.
All the choices containing "Not" negate their equivalent in the positive form. For example, if we have "wlan.fc.type == 2" as an existing filter and use ... and not Selected with wlan.fc.subtype and value of "0", the filter becomes "(wlan.fc.type == 2) && !(wlan.fc.subtype == 0)".
Note that Apply as filter builds and applies the filter immediately. While Prepare a filter only updates the contents of the display filter bar and doesn't apply the filter until we click Apply display filter at the end of the display filter textbox.

Figure 17: Apply as Filter submenu
Prepare a filter is useful when we want to build a complex filter that will require multiple steps. As the list of collected packets gets longer, it can take time to process each new subfilter that gets applied. It might be easier to wait to apply the filter until after we have finished writing the complete query.
Display Filter Toolbar
We can also create and access display filters directly in the Display Filter toolbar. On the left, a blue ribbon icon will bring us to bookmarked filters.

Figure 18: Display Filter bar
To the right of the filter bar there is an arrow and a dropdown icon. The arrow will apply the filter, while the dropdown will show the most recent display filters.

Figure 19: Display Filter bar - Recent filters dropdown
When creating a filter, Wireshark's autocompletion displays valid filters as the expression is typed.
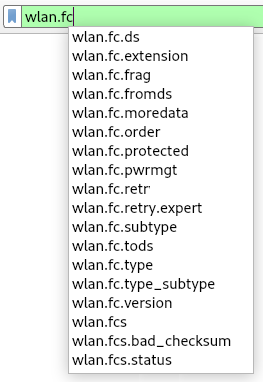
Figure 20: Display filter autocomplete
The toolbar provides filtering hints with colored backgrounds. A valid filter is displayed with a green background. An invalid filter is indicated by a red background. For example, the "wlan.fc.type = 1" filter is syntactically incorrect because it uses only a single "=", so it appears with a red background.

Figure 21: Invalid filter
A yellow background indicates a possibly questionable filter.

Figure 22: Filter with possibly unexpected results
Yellow doesn't always mean the filter is incorrect. In most cases, it will be correct as most filters reference a single field. In this specific example, it is correct and will show packets with a wlan.fc.type with a value not equal to "1". It is good practice to use the double equal and then negate the entire expression instead. This would be written as "!(wlan.fc.type == 1)".
Display Filters Bookmarks
When doing a lot of packet filtering, we may want to reuse filters. This is where the bookmarks come in handy. They allow us to save display filters for later use. The bookmark button is located on the left of the Display Filter toolbar.

Figure 18: Display Filter bar
Clicking on the bookmark reveals a default set of display filters and any additional saved filters.
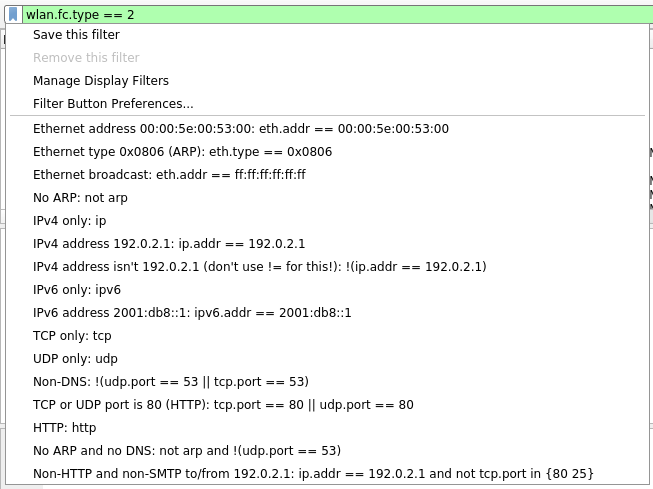
Figure 23: Display Filter bar
When a valid filter is in the Display Filter toolbar, Save this filter is clickable in the bookmark dropdown menu. Saving the filter opens the Display Filters screen and the new filter is displayed at the bottom of the list. Selecting OK saves the filter in the bookmark list.
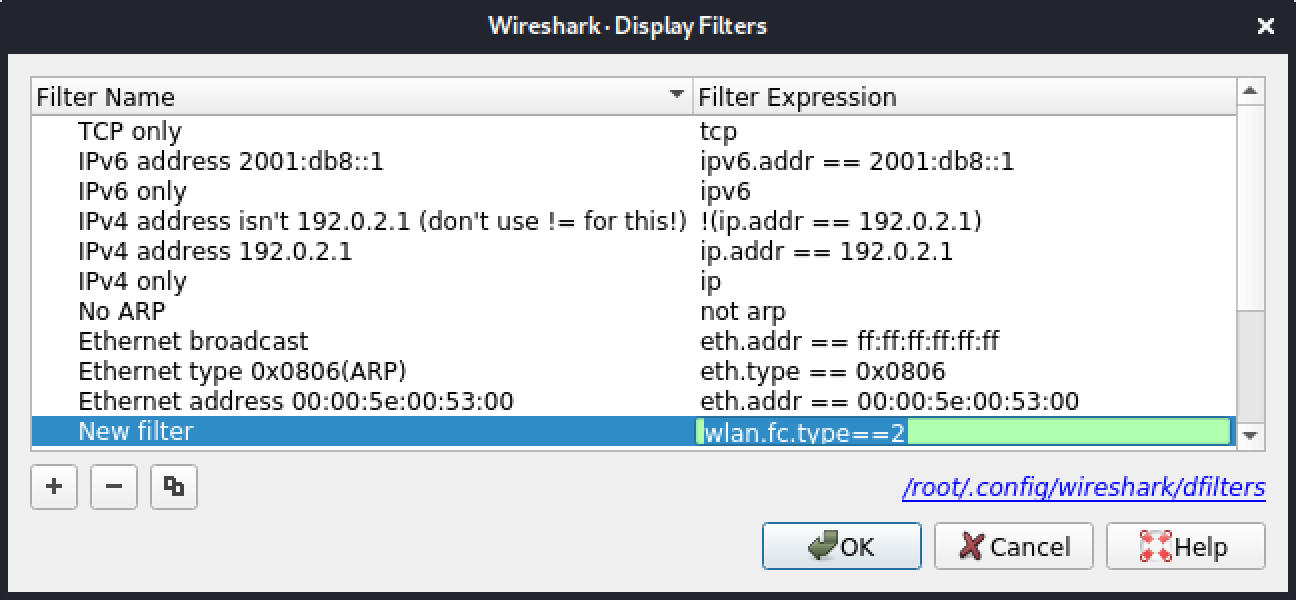
Figure 24: Display filter window - Save filter
We can create and save a new filter by either selecting Manage Display Filters from the bookmarks dropdown menu or via Analyze > Display Filters.... Both of these options open the Display Filters screen.
We can edit an existing filter by selecting it and applying valid changes. Valid changes are indicated by the green (or yellow) background in the Filter field. Filters from the list can be deleted with the minus ("-") button or duplicated with the Copy button.
Display Filter Buttons
We can add a shortcut to the Display Filter toolbar for frequently used filters by selecting the plus ("+") icon located on the very right of the toolbar. This opens a Create Shortcut Button panel.

Figure 25: Display Filter button settings
We will enter the name of the shortcut in the Label field and enter the filter in the Filter field. The Comment field is for a description that appears when hovering the mouse over the shortcut button.
Let's create a "Data" button using our "wlan.fc.type == 2" data frames filter and an "802.11 data frames" comment.

Figure 26: Display Filter button creation
Selecting OK creates our Data button to the right on the Display Filter toolbar. Hovering the mouse on the button displays the filter's comment.
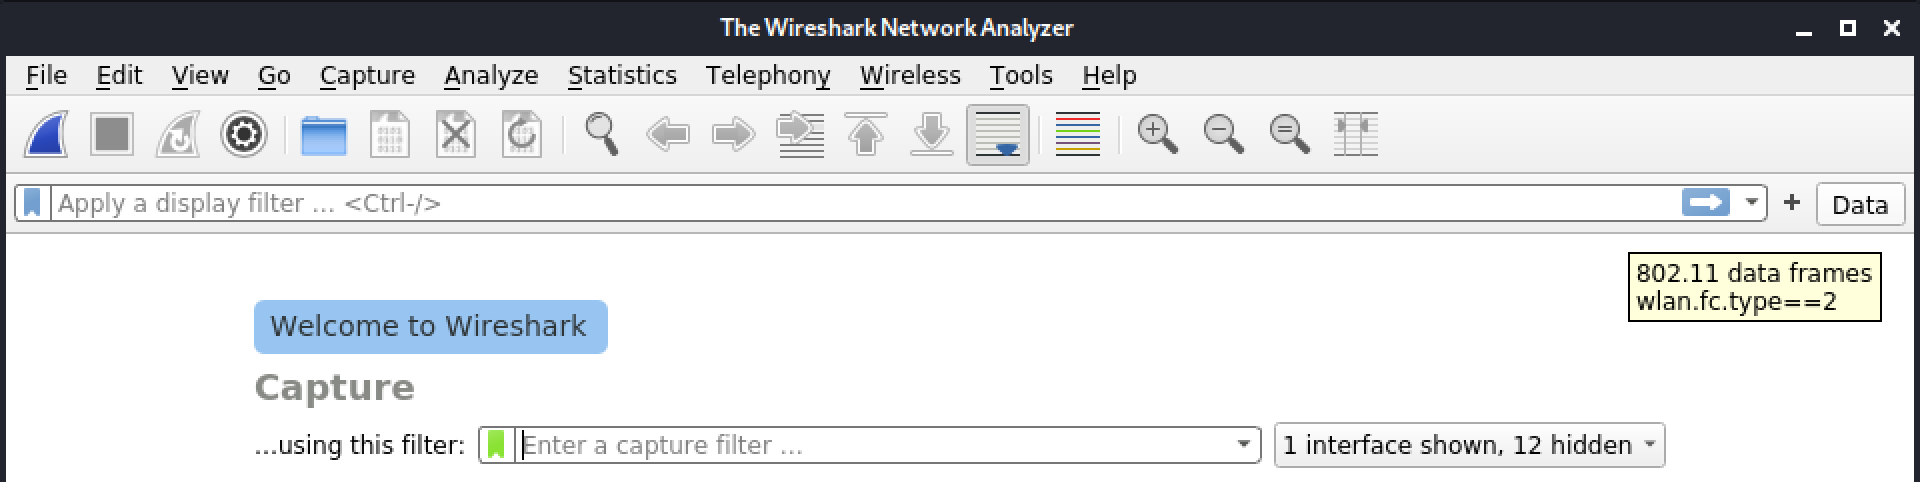
Figure 27: Display Filter button
Clicking on our new button sets the content of the filter toolbar to "wlan.fc.type == 2". Right-clicking the button gives us options to edit, disable, or remove the button.
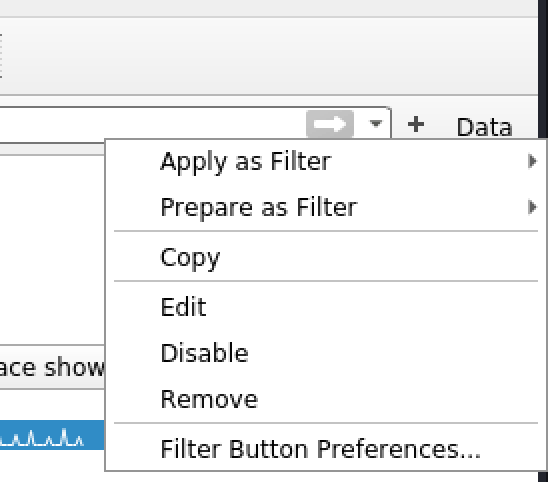
Figure 28: Display Filter buttons preferences
Editing a button will bring back the creation panel below the Display Filter bar. This time, the creation panel will be prefilled with the button's existing settings.
Filter buttons can also be created, deleted, or edited via Edit > Preferences..., and selecting Filter Buttons in the left panel.
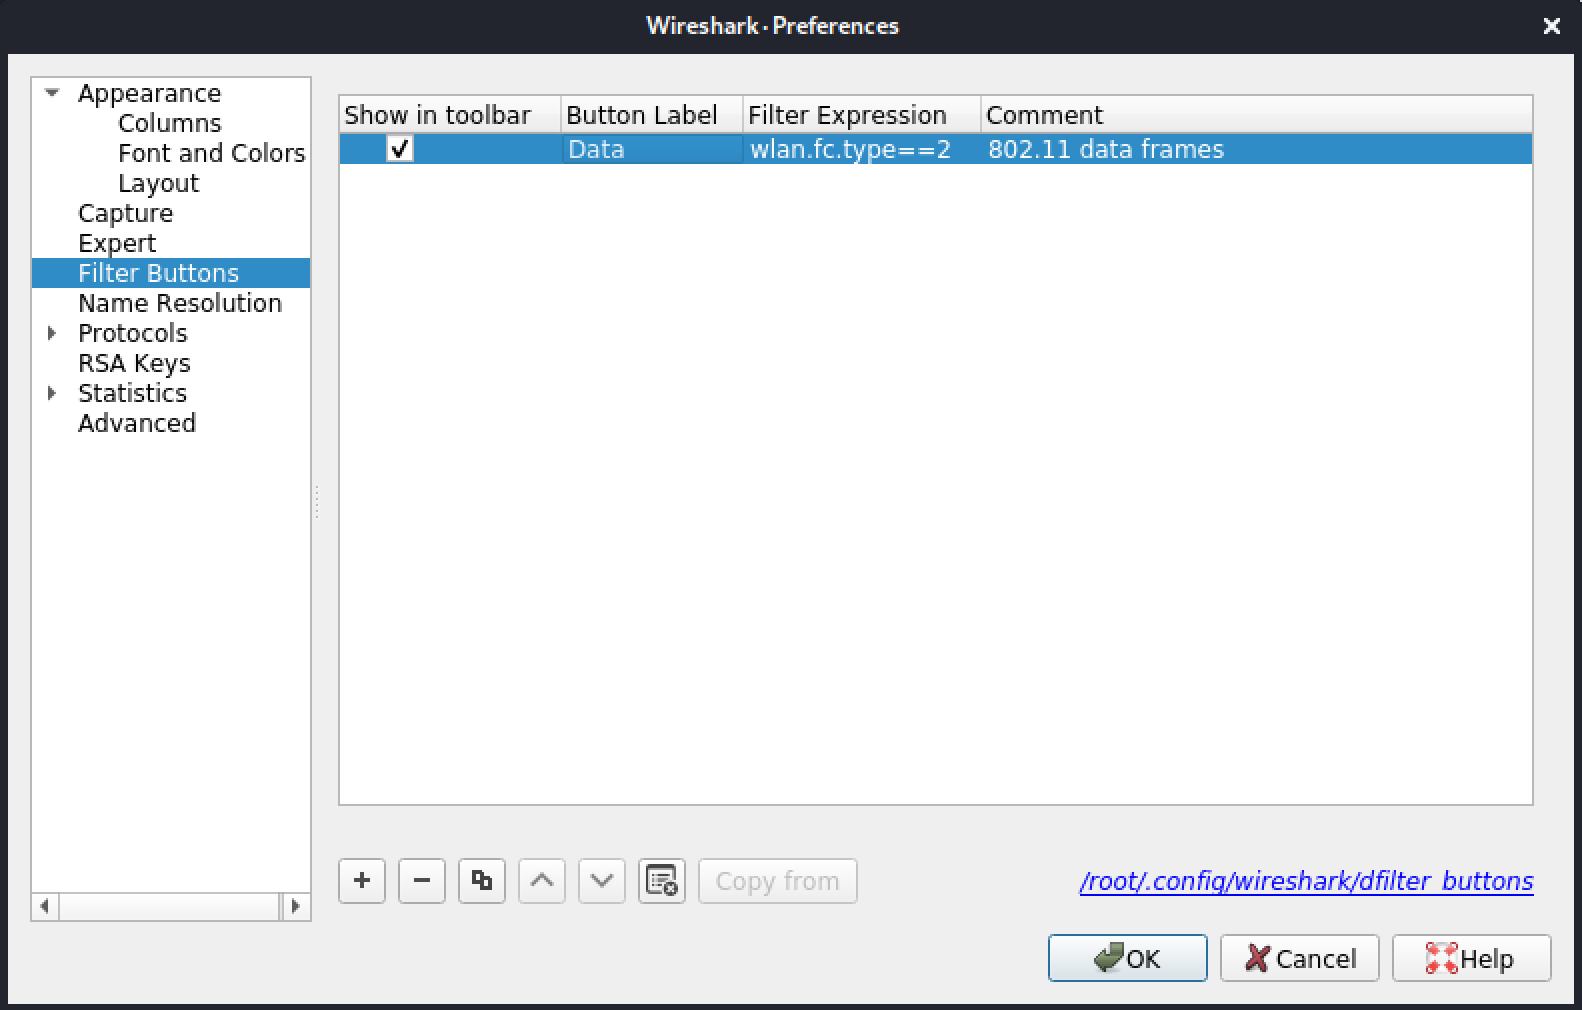
Figure 29: Display Filter buttons preferences
Exercise
Configure your lab AP to use WPA encryption, either with TKIP or CCMP (sometimes shown as AES). Ensure that your wireless card is in monitor mode on the same channel as your AP.
With a capture running, create a display filter for the BSSID of your lab AP. The BSSID is usually printed on a sticker on the back on the AP but can also be found in the frames by looking for Beacon frames with your SSID.
1 (Wireshark Foundation, 2017), https://wiki.wireshark.org/DisplayFilters ↩︎
4.2.2. Wireshark Capture Filters
Capture Filters1 allow Wireshark to only collect a specific type of data. Display filters, which we just discussed, decrease the amount of data displayed, while capture filters limit the amount of data received. While they might seem similar, there are a number of reasons why we might opt to use capture filters instead of display filters.
Warning
Capture filters are also sometimes called Berkeley Packet Filters (BPF).2
When capturing, Wireshark and tshark temporarily store and dissect each packet in memory (unless specified otherwise in the options). As the amount of data increases, the memory and CPU requirements grow. If packets can't be dissected, they may be dropped, and one of those dropped packets could contain crucial information. Using a capture filter allows us to cut down on the amount of data captured so we can focus on the data that we really need.
Another reason to use a capture filter is when we are only allowed to look at specific traffic, such as when isolating the traffic of one or more devices.
We need to be careful when creating this type of filter, as we can't recover data that we don't capture. If we make a mistake with a display filter, we can simply remove the filter to "unhide" the necessary packets.
Capture filters for Wi-Fi are limited to filtering on MAC addresses and on frame types/subtypes. They are documented in the pcap-filter man page.3
Example: Filtering out Beacons
The most common type of Wi-Fi frames are beacons. Every AP sends them approximately 10 times per second to announce its presence. Beacon frames aren't particularly useful when looking at traffic and are often the first type of frames excluded using display filters. We can save a bit of time by filtering them beforehand. Let's select our wireless interface (wlan0mon) and then place "not subtype beacon" in the capture filter field.
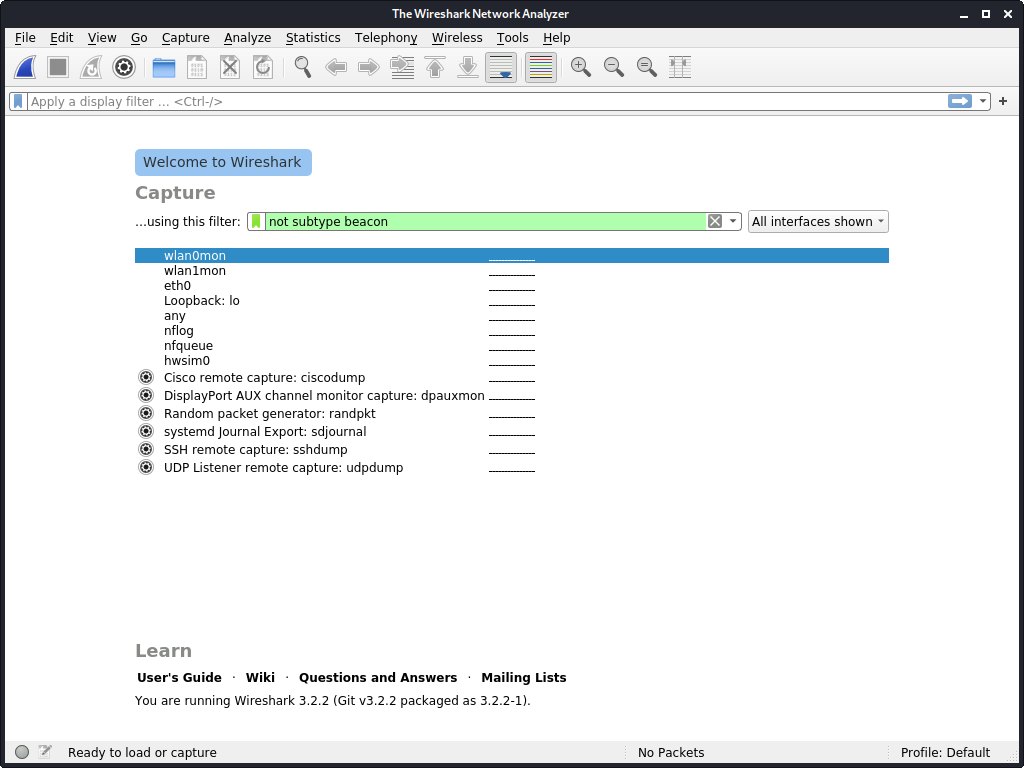
Figure 30: Capture filter - ignore beacons
Next we click the shark fin to start our capture without beacon frames, thereby eliminating unnecessary traffic and data.
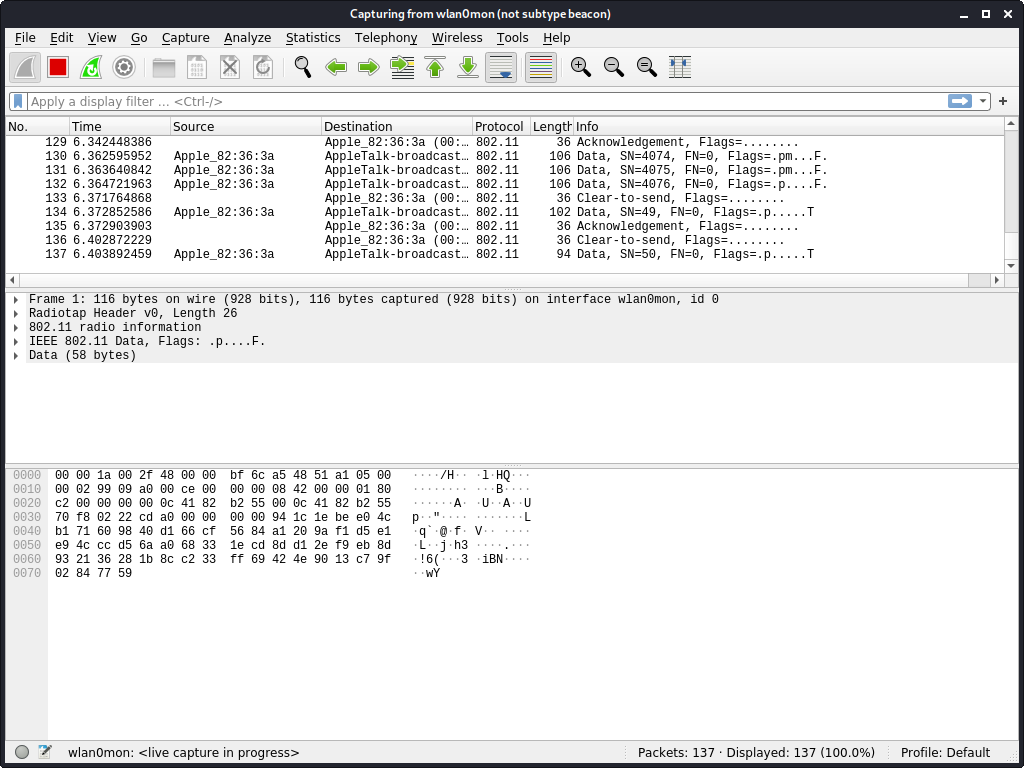
Figure 31: Capture filter - Capturing
Capture filters refine our results based on values in each frame we receive. One of those values contained in a wireless frame is between one and four MAC addresses.4 To only capture frames from a specific device, we'll have to build a filter to match one of these addresses.
Let's try and capture the wireless traffic of the device 3A:30:F9:0F:E1:95. We'll start our capture with the following filter. To ensure we capture all relevant traffic, let's include all four possible locations where our MAC address might appear.
(wlan addr1 3A:30:F9:0F:E1:95) or (wlan addr2 3A:30:F9:0F:E1:95) or (wlan addr3 3A:30:F9:0F:E1:95) or (wlan addr4 3A:30:F9:0F:E1:95)
Listing 3 - Filtering for a device
The parentheses included here are optional, but they make it a bit easier to read the filter.
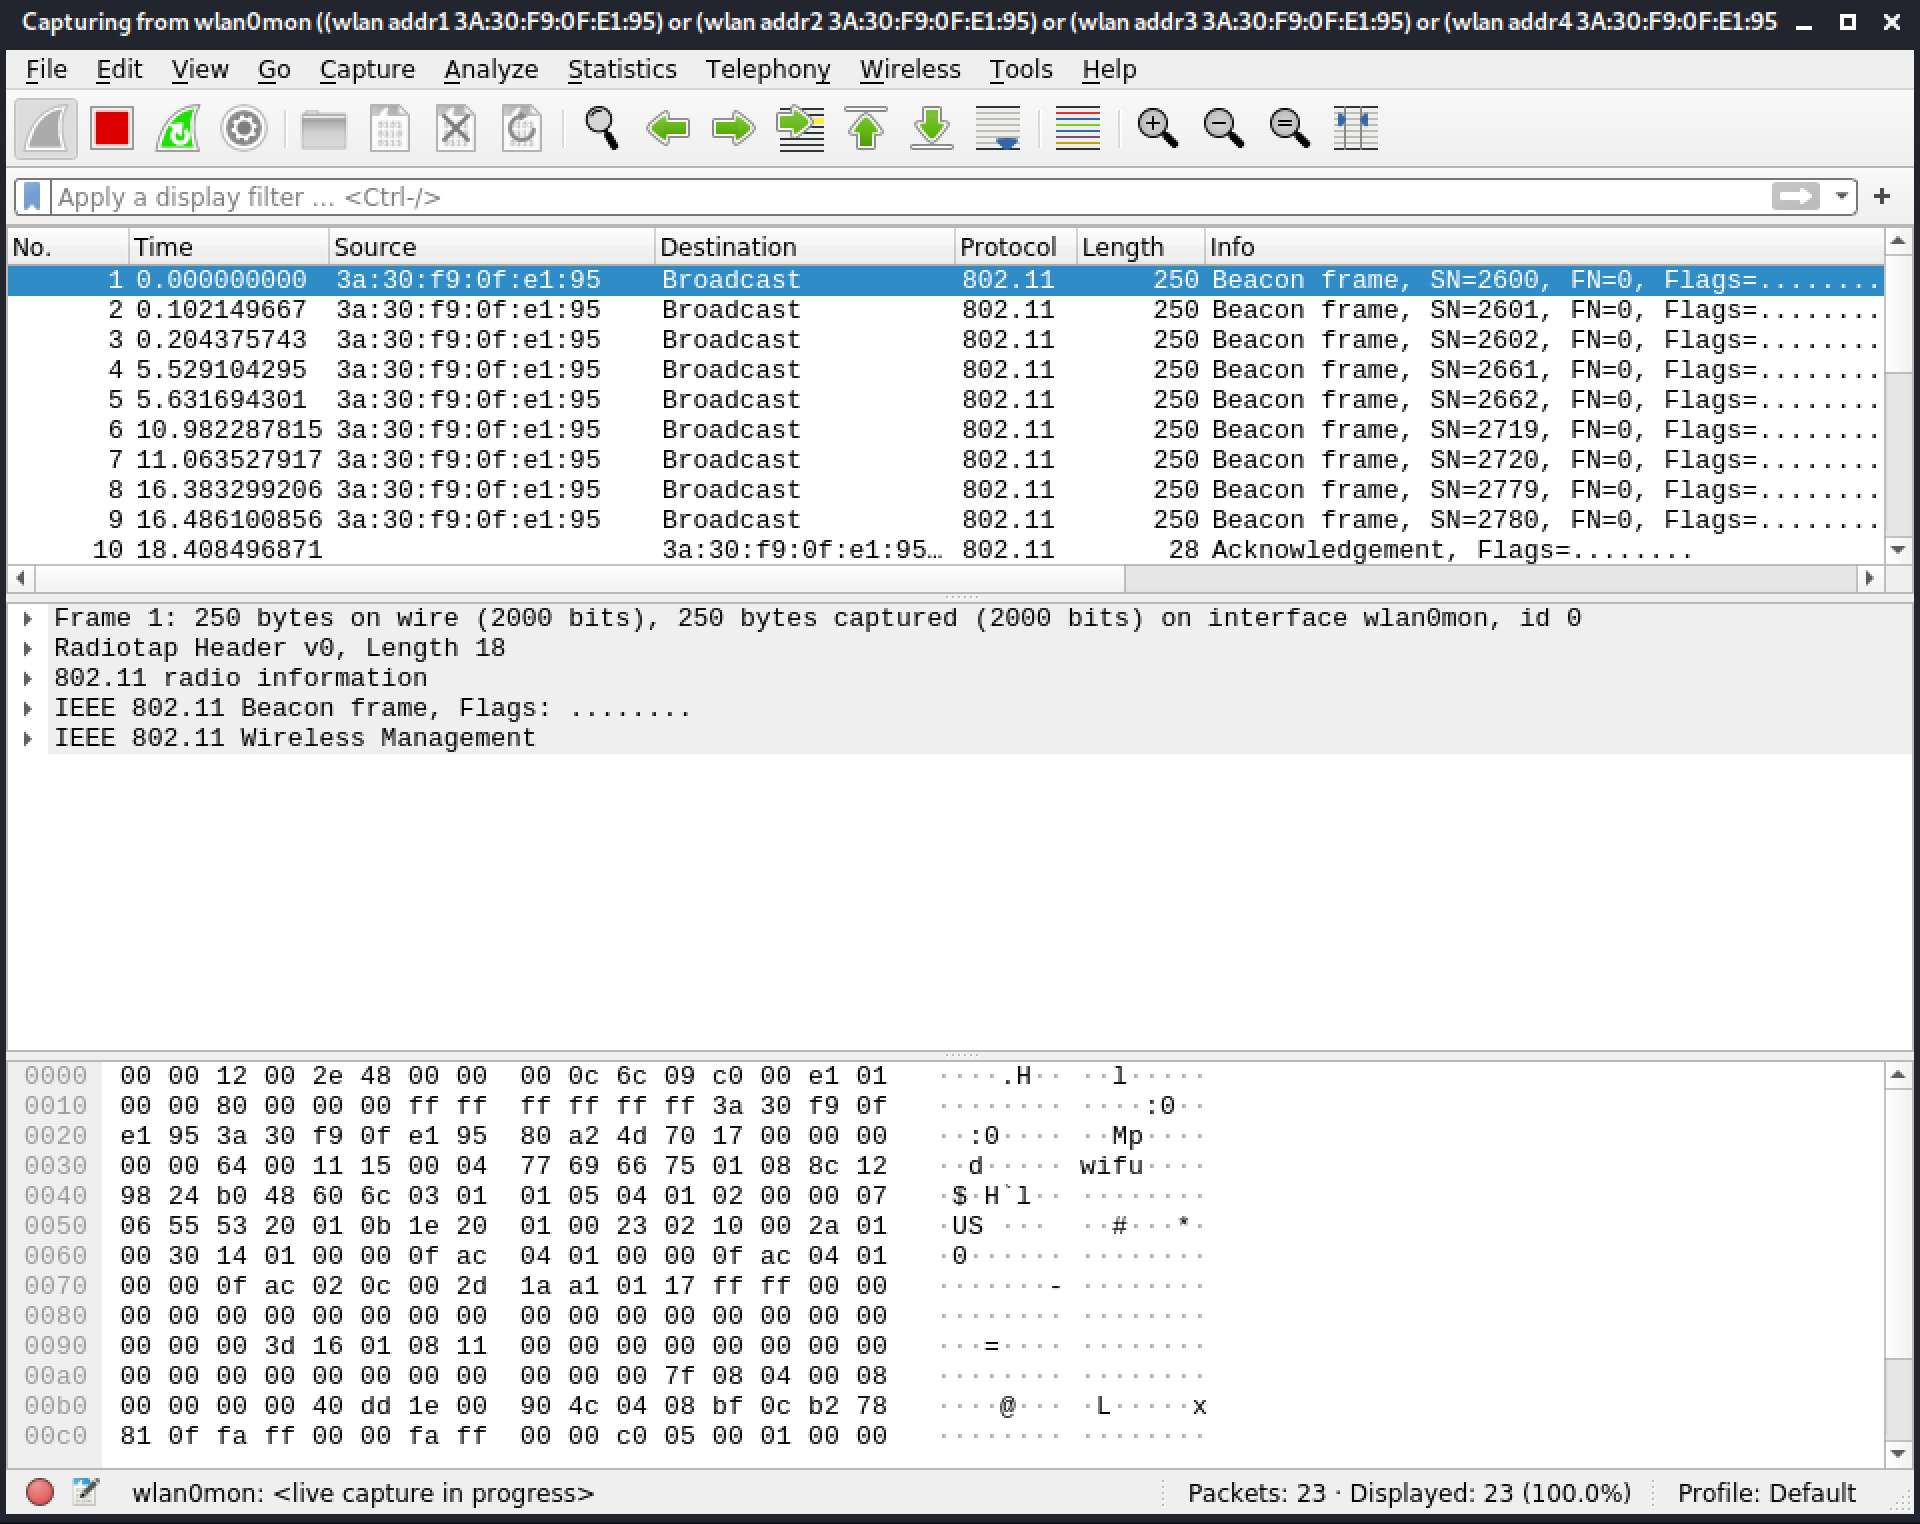
Figure 32: Capture filter - Capturing a specific device
In Figure 32, we find that our filter was successful. We are only capturing frames related to our specified device.
Let's combine our device capture filter with the beacon frames filter.
((wlan addr1 3A:30:F9:0F:E1:95) or (wlan addr2 3A:30:F9:0F:E1:95) or (wlan addr3 3A:30:F9:0F:E1:95) or (wlan addr4 3A:30:F9:0F:E1:95)) and (not subtype beacon)
Listing 4 - Device capture filter with the beacon frames filter
We are still capturing control frames we don't need, such as acknowledgement, request to send (rts), clear to send (cts), etc. We can filter these out with "not type control".
There are other frames we can filter out as well. Let's cut out management frames we don't need, such as probe requests and responses. We can do this with "not subtype probe-req" and "not subtype probe-resp". We will add these to our capture filter.
((wlan addr1 3A:30:F9:0F:E1:95) or (wlan addr2 3A:30:F9:0F:E1:95) or (wlan addr3 3A:30:F9:0F:E1:95) or (wlan addr4 3A:30:F9:0F:E1:95)) and not (subtype beacon) and not (type ctl) and not (subtype probe-req) and not (subtype probe-resp)
Listing 5 - Our expanded capture filter
The capture filter is quite long, so we may want to save it for future use. We'll click on the bookmark to reveal the Save this filter option as well as a default set of capture filters and any previously saved filters.
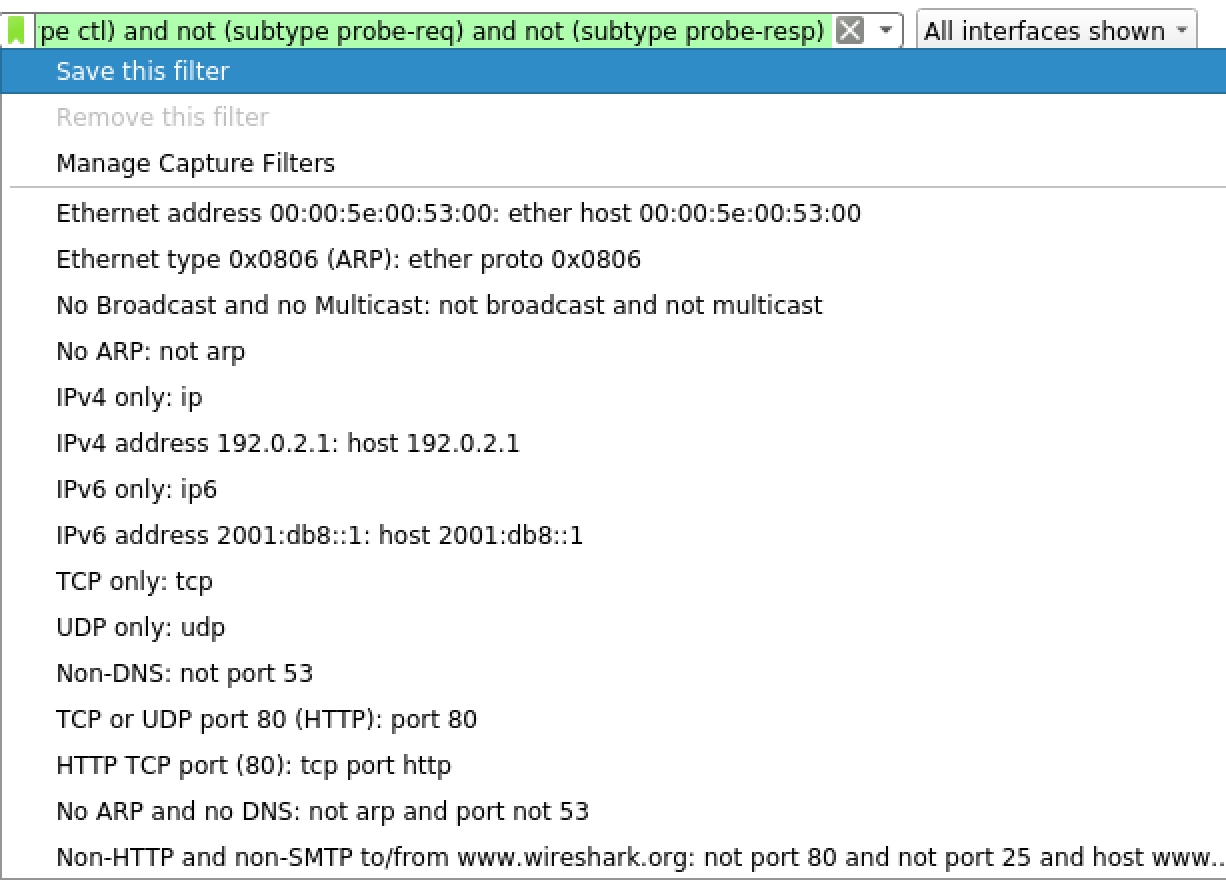
Figure 33: Capture filter - Capture filter bookmarks
We'll select the save option, which opens the Manage Capture Filters screen, Let's save our new capture filter as "wifu".
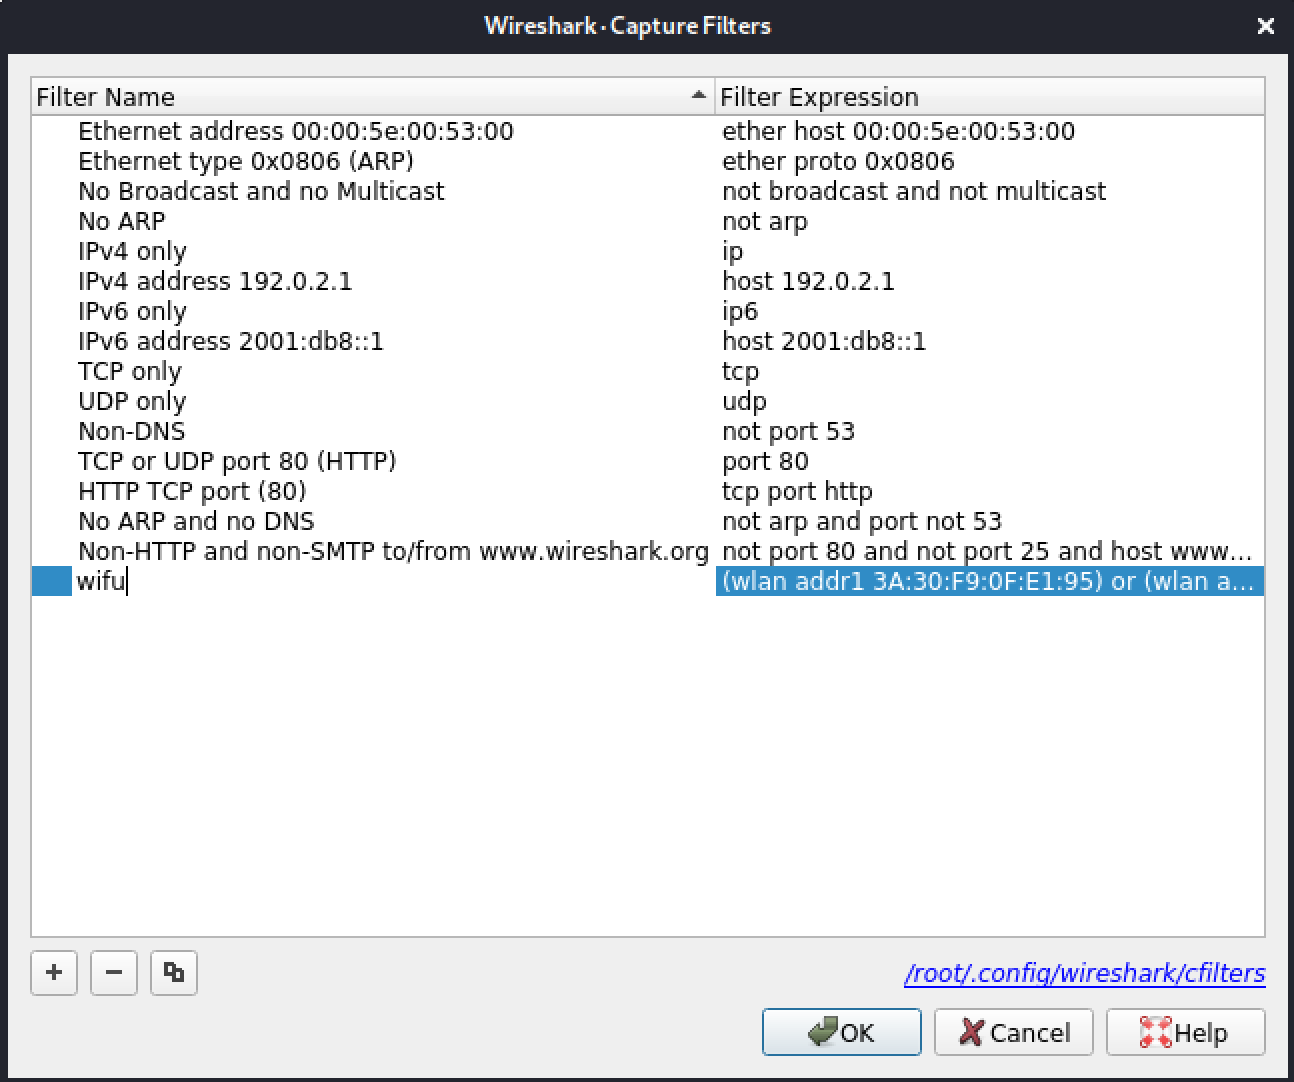
Figure 34: Capture filter - Saving a capture filter
Finally, we'll apply the saved filter. Now our capture only collects relevant frames.
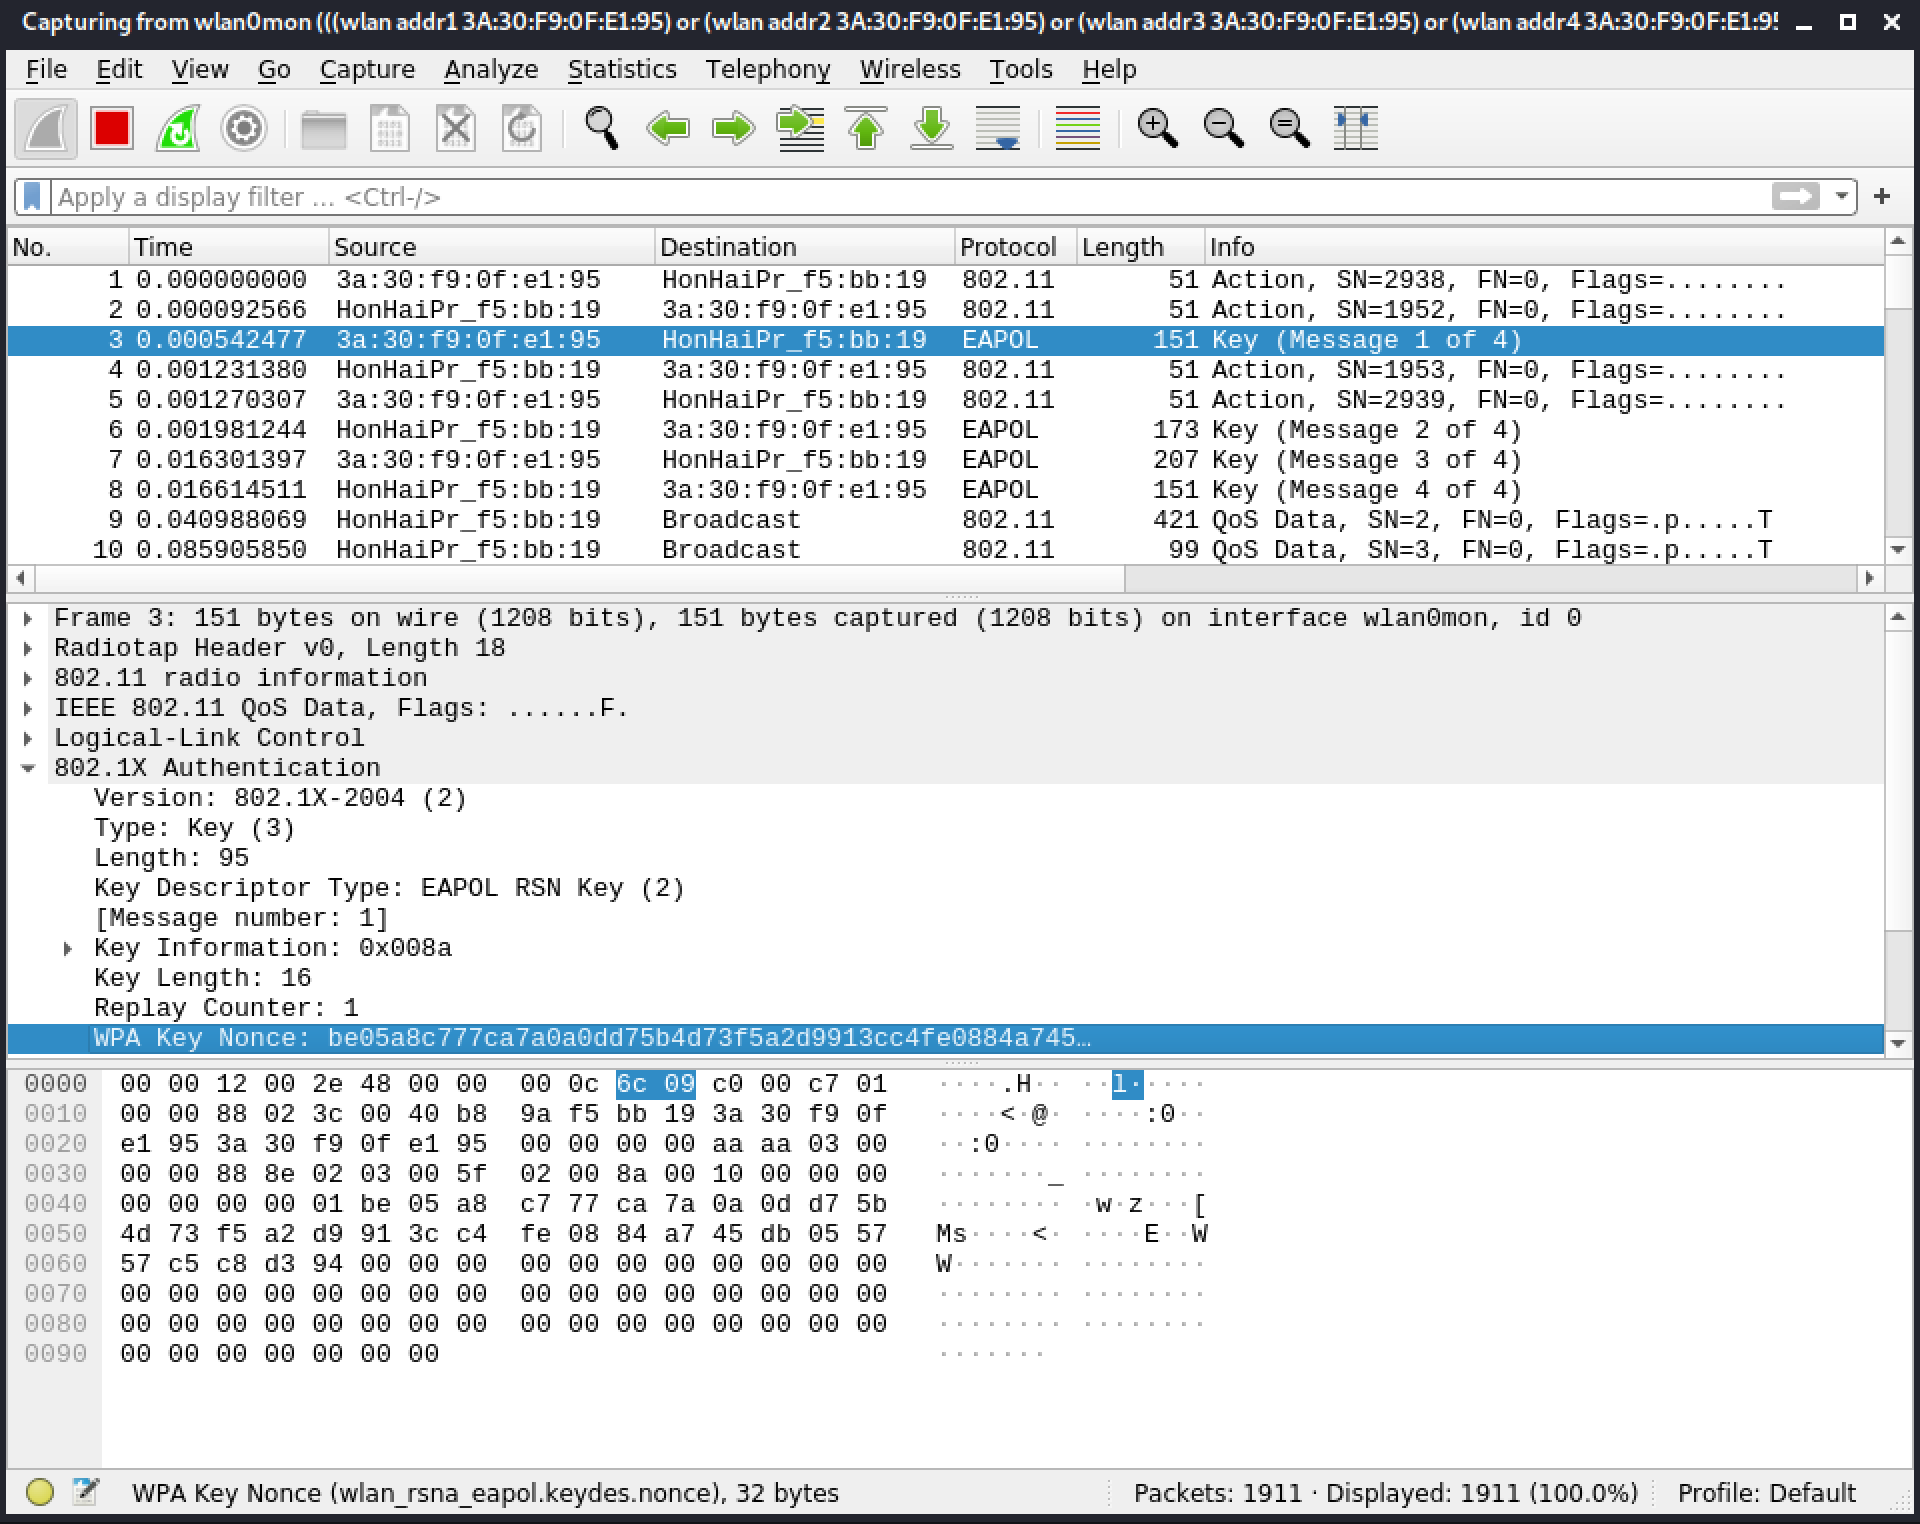
Figure 35: Capture filter - relevant frames
Exercise
Start a packet capture in Wireshark with a capture filter for:
- Beacons
- Probes (requests and responses)
- Association (requests and responses)
- Data (any)
- A specific MAC address
1 (Wireshark Foundation, 2016), https://wiki.wireshark.org/CaptureFilters ↩︎
2 (Wikipedia, 2021), https://en.wikipedia.org/wiki/Berkeley_Packet_Filter ↩︎
3 (Tcpdump Group, 2021), https://www.tcpdump.org/manpages/pcap-filter.7.html ↩︎
4 (Wi-Fi Notebook, 2013), http://80211notes.blogspot.com/2013/09/understanding-address-fields-in-80211.html ↩︎
4.3. Wireshark at the Command Line
Although Wireshark is a GUI, it has a number of useful command line parameters. To display a list of all of the possible parameters, we can run wireshark --help from the command line. Listing 6 shows some of Wireshark's most useful options.
kali@kali:~$ wireshark --help
Wireshark 3.2.1 (Git v3.2.1 packaged as 3.2.1-1)
Interactively dump and analyze network traffic.
See https://www.wireshark.org for more information.

Usage: wireshark [options] ... [ <infile> ]

Capture interface:
  -i <interface>, --interface <interface>
                           name or idx of interface (def: first non-loopback)
  -f <capture filter>      packet filter in libpcap filter syntax
  -s <snaplen>, --snapshot-length <snaplen>
                           packet snapshot length (def: appropriate maximum)
...
  -k                       start capturing immediately (def: do nothing)
...
  -I, --monitor-mode       capture in monitor mode, if available
...
  -D, --list-interfaces    print list of interfaces and exit
...
Listing 6 - List of Wireshark interfaces
Let's cover the items shown in the listing above.
The -D option lists all the available interfaces along with their index numbers.
kali@kali:~$ sudo wireshark -D
Capture-Message: 14:05:44.552: Capture Interface List ...
Capture-Message: 14:05:44.697: Loading External Capture Interface List ...
1. eth0
2. lo (Loopback)
3. any
4. wlan0mon
5. nflog
6. nfqueue
7. ciscodump (Cisco remote capture)
8. dpauxmon (DisplayPort AUX channel monitor capture)
9. randpkt (Random packet generator)
10. sdjournal (systemd Journal Export)
11. sshdump (SSH remote capture)
12. udpdump (UDP Listener remote capture)
Listing 7 - List of Wireshark interfaces
The -i option is to specify the name or the index of the interface to capture on. It should be followed by the interface name or index. Using a single hyphen, -, as the interface name will capture on STDIN. This will come in handy when using pipes, as we will explain later.
It's common to use the -k option after -i. The -k option automatically starts the capture. With our wireless interface in monitor mode, we can start our capture with the following command.
kali@kali:~$ sudo wireshark -i wlan0mon -k
QStandardPaths: XDG_RUNTIME_DIR not set, defaulting to '/tmp/runtime-root'
...
Listing 8 - Starting capture on wlan0mon
This will automatically open the GUI with the packet capture running.
One scenario where we might use -i without -k is when we want to start Wireshark, select an interface that isn't up yet, and then manually start the capture once the interface is up. For now, let's continue to use -k.
Next, let's add the -I option, which enables monitor mode in the selected wireless interface.
kali@kali:~$ sudo wireshark -i wlan0 -I -k
QStandardPaths: XDG_RUNTIME_DIR not set, defaulting to '/tmp/runtime-root'
...
Listing 9 - Putting wlan0 in monitor mode and starting capture
We can also use the -i option with an interface's index. We checked the index in Listing 7. Let's replace wlan0mon with the corresponding index number, 4.
kali@kali:~$ sudo wireshark -i 4 -I -k
QStandardPaths: XDG_RUNTIME_DIR not set, defaulting to '/tmp/runtime-root'
...
Listing 10 - Starting capture with interface index
Let's continue to add to this command. We can add a beacon frame capture filter with the -f option.
kali@kali:~$ sudo wireshark -i wlan0mon -k -f "not subtype beacon"
QStandardPaths: XDG_RUNTIME_DIR not set, defaulting to '/tmp/runtime-root'
Listing 11 - Starting capture with a Beacon frame capture filter
Wireshark can capture the first few bytes of each frame instead of the full frame with -s option followed by the length in bytes.
kali@kali:~$ sudo wireshark -i wlan0mon -k -s 60
QStandardPaths: XDG_RUNTIME_DIR not set, defaulting to '/tmp/runtime-root'
Listing 12 - Starting capture with a snapshot length of 60 bytes
We can also use Wireshark to simply open capture files, with or without additional parameters. If we use parameters, we have to specify them before the capture filename. Capture files usually have an extension of .cap or .pcap.
kali@kali:~$ wireshark wifi.pcap
16:36:29.699          Warn Invalid borders specified for theme pixmap:
        /usr/share/themes/Kali-Dark/gtk-2.0/assets/trough-scrollbar-horiz.png,
borders don't fit within the image
...
Listing 13 - Opening wifi.pcap
Wireshark doesn't need elevated privileges (sudo) when opening files, unless the file's permissions requires it.
Exercises
Start Wireshark from the command line using the following options:
- Initiate immediate capture with your wireless interface.
- Initiate immediate capture and place your wireless interface in monitor mode.
- Initiate immediate capture with a capture filter.
- Open a .pcap file.
4.4. Remote Packet Capture
Not only can we use Wireshark to capture packets passing through a local interface, but it can also capture packets remotely from another system's interface. This comes in handy when the local system doesn't have the ability to capture packets, or when we are trying to diagnose an issue remotely.
There are a few different ways that we can capture packets remotely. The first one, using the command line, is to run a command remotely using SSH, output the results, and pipe them to Wireshark. We could also use Wireshark's built-in tool, SSHdump,1 to achieve the same as the command line.
SSHdump is easier and more convenient, but command-line options are more stable.
Let's take a quick look at two other methods for remote capture. First, we could use a RPCAP URI.2 This only works on Windows, where Wi-Fi packet capture is severely limited. Second, we could use udpdump3 to receive data through a UDP listener. Both of these methods have very limited use and will not be practical for our purposes.
1 (Dario Lombardo), https://www.wireshark.org/docs/man-pages/sshdump.html ↩︎
2 (WinPcap, 2007), https://www.winpcap.org/docs/docs_40_2/html/group__remote.html ↩︎
3 (Wireshark Foundation, 2021), https://www.wireshark.org/docs/man-pages/udpdump.html ↩︎
4.4.1. Remote Packet Capture Setup
Let's begin to work towards remote packet capture. We'll begin locally, by covering how to capture and output wireless packets on STDOUT. Next, we'll cover how to pipe the STDOUT wireless packets to Wireshark. Finally, we'll cover how to combine those two, doing the first part remotely and the second part locally.
Capture and Output Packets on STDOUT
We can use any tool capable of capturing data and outputting to STDOUT. The ones we will demonstrate here will be tcpdump, dumpcap, and tshark.
Since not all tools will be available on all systems, it is important for us to know how to use each of them. Another thing we need to take into consideration is CPU usage. Dumpcap has lower overhead compared to tcpdump and tshark. The difference in CPU usage between these tools may be negligible when using a desktop or a laptop as the remote capture device. It's more likely that we will notice a difference when we start transferring more traffic or if we use low power devices such as routers, single-board computers (SBC),1 or access points as capture devices.
Let's begin with tcpdump. Assuming we have enabled monitor mode, we can specify our capture interface with -i wlan0mon. We will write the raw packets to a file with -w but to STDOUT with a hyphen, - rather than to a file name. Next, the -U option outputs each packet as it arrives. This last option is helpful since the default behavior is to wait for the system's buffer to fill before outputting bursts of packet output.
kali@kali:~$ sudo tcpdump -i wlan0mon -w - -U
�ò�tcpdump: listening on wlan0mon, link-type IEEE802_11_RADIO (802.11 plus radiotap header), capture size 262144 bytes
Listing 14 - TCPdump output on stdout
Let's review the tcpdump output a bit. The non-printable characters are the raw .pcap that will be decoded by Wireshark.
Incidentally, this link type message is sent to STDERR for output into the terminal. The non-printable characters are sent to STDOUT and will be what we use with Wireshark.
We exit tcpdump with C+c and statistics of the capture are output in the console.
151 packets captured
160 packets received by filter
0 packets dropped by kernel
1 packet dropped by interface
Listing 15 - Statistics from TCPdump when exiting Wireshark
The dumpcap tool's usage is similar to tcpdump when sending the captured data to STDOUT. One difference is that dumpcap requires the -P option to output the data in PCAP format.
kali@kali:~$ sudo dumpcap -w - -P -i wlan0mon
Capturing on 'wlan0mon'
�ò�File: -
9UY^m*.Hl   �������������5����5��1�d
...
Listing 16 - dumpcap output on stdout
To do the same thing with tshark, we would use the command below.
kali@kali:~$ sudo tshark -w - -i wlan0mon
Running as user "root" and group "root". This could be dangerous.
Capturing on 'wlan0mon'

�M<+���������6Intel(R) Core(TM) i7-9750H CPU @ 2.60GHz (with SSE4.2)Linux 5.4.0-kali3-amd64:Dumpcap (Wireshark) 3.2.1 (Git v3.2.1 packaged as 3.2.1-1)�wlan0mon
...
Listing 17 - tshark output on stdout
Pipe Packets to Wireshark
Now that we understand the basics of packet capture to STDOUT, the next step is to pipe the packets to Wireshark.
Pipes are a form of Inter-Process Communication (IPC) objects of which there are two types, named and unnamed pipes.
Named pipes, also known as First in, First out (FIFO) IPC objects, are present on the filesystem and allow bi-directional communications.
Unnamed pipes, also known as unnamed IPC objects, make use of the pipe() function. One way we might use this function is when we chain commands in terminals by using the pipe (|) character.2
Choosing between one type or the other depends on the application, its options, and capabilities.3 Some applications may not support any and some may only support one kind. In the case of Wireshark, both options are available.
Unnamed Pipe
Unnamed pipes allow us to chain commands together by passing the output of one command to the input of another. We will show an example with the following command.
Listing 18 - Pipe example
In listing 18, we ran two commands. The first is ls /var/log, which lists the contents of the /var/log directory. As the output from the command may be too long to fit in the terminal display, piping the output to the more command will allow us to page through the results. In this case, the output of the first command becomes the input for the second command.
We're not limited to using a single pipe, either. Let's explore the possibilities a bit by building on the previous command. We will insert sort between ls /var/log and more in order to sort the list of files and directories in reverse order. After we've done that, more will let us page through the newly sorted results.
Listing 19 - Chaining commands using multiple pipes
Let's apply this concept to packet capture by launching our tcpdump command (or an equivalent dumpcap or tshark command) and piping the output to Wireshark.
kali@kali:~$ sudo tcpdump -U -w - -i wlan0mon | wireshark -k -i -
tcpdump: listening on wlan0mon, link-type IEEE802_11_RADIO (802.11 plus radiotap header), capture size 262144 bytes
Listing 20 - Capturing traffic and piping it to Wireshark
Wireshark launches and displays the flowing wireless frames as they arrive.
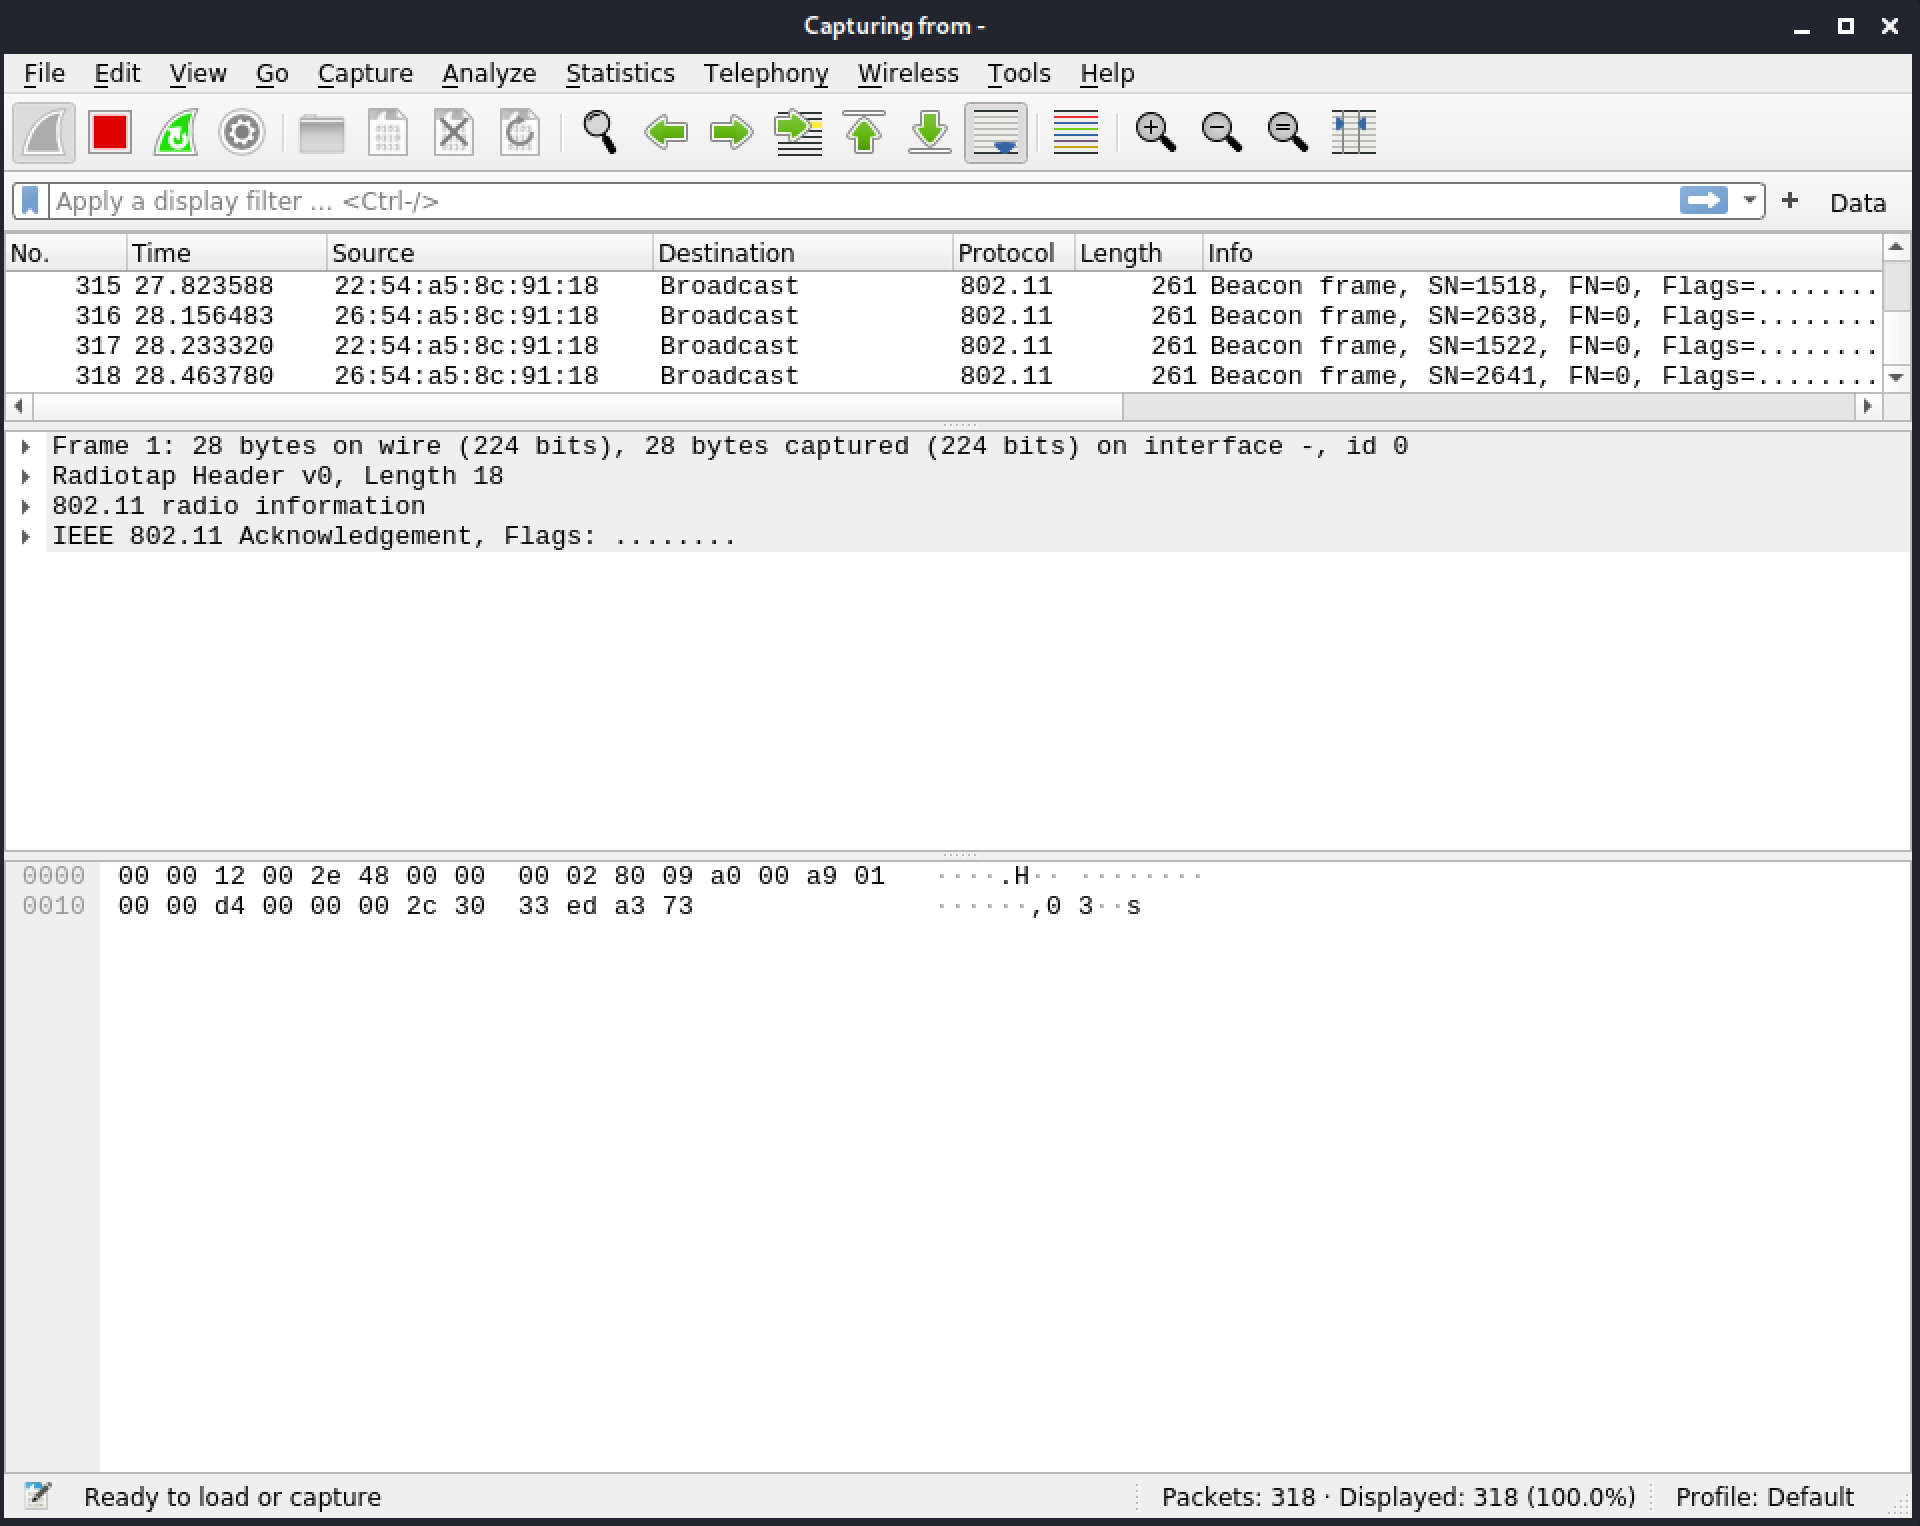
Figure 36: tcpdump live output piped to Wireshark
Since pipes only transfer STDOUT, that data becomes STDIN for what is displayed in Wireshark. All we are shown in the command terminal is STDERR.
Named Pipe Devices
Named pipes are similar to unnamed pipes. They also allow two or more processes to communicate, but, as the name suggests, they have a name and (in the case of *Nix OSs) are present on the file system. This has the additional benefit of allowing us to set permissions and limit access.
Our focus is on Linux, but named pipes also exist on Windows, where they are handled a bit differently.4
Let's create the named pipe using mkfifo followed by its chosen pathname.
kali@kali:~$ mkfifo /tmp/named_pipe

kali@kali:~$ ls -l /tmp/named_pipe
prw-r--r-- 1 kali kali 0 Jul 27 20:47 /tmp/named_pipe
Listing 21 - Creating and checking named pipe
The "p" in the beginning of the file permissions indicates it is a pipe.
Wireshark's -i option is quite versatile. Let's use this named pipe as our interface.
Listing 22 - Starting capture with Wireshark on a named pipe
After executing the command, Wireshark starts but will not display packets until another capture tool writes data to the named pipe.
Another option is to configure our named pipe from within Wireshark. In the Wireshark menu, we will navigate to Capture > Options....
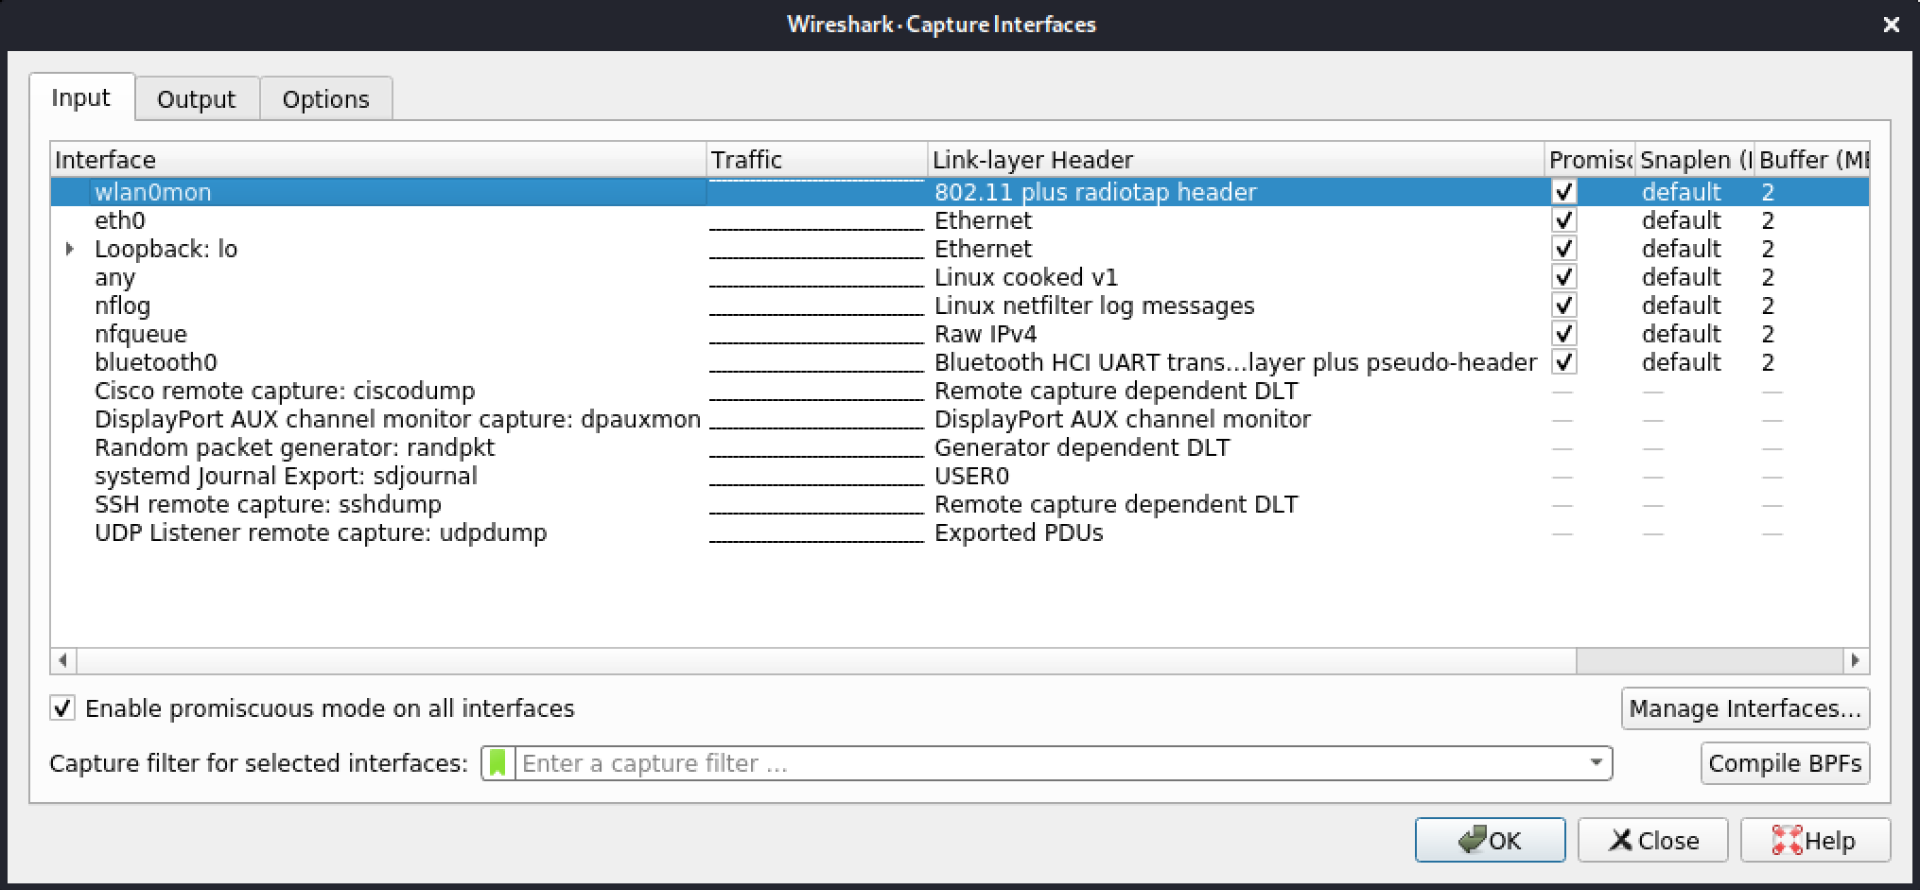
Figure 37: Capture interfaces list
Let's click on the Manage Interfaces button, select the Pipes tab, and click on the + to create a new pipe. Finally, we'll enter the named pipe's path name, /tmp/named_pipe.
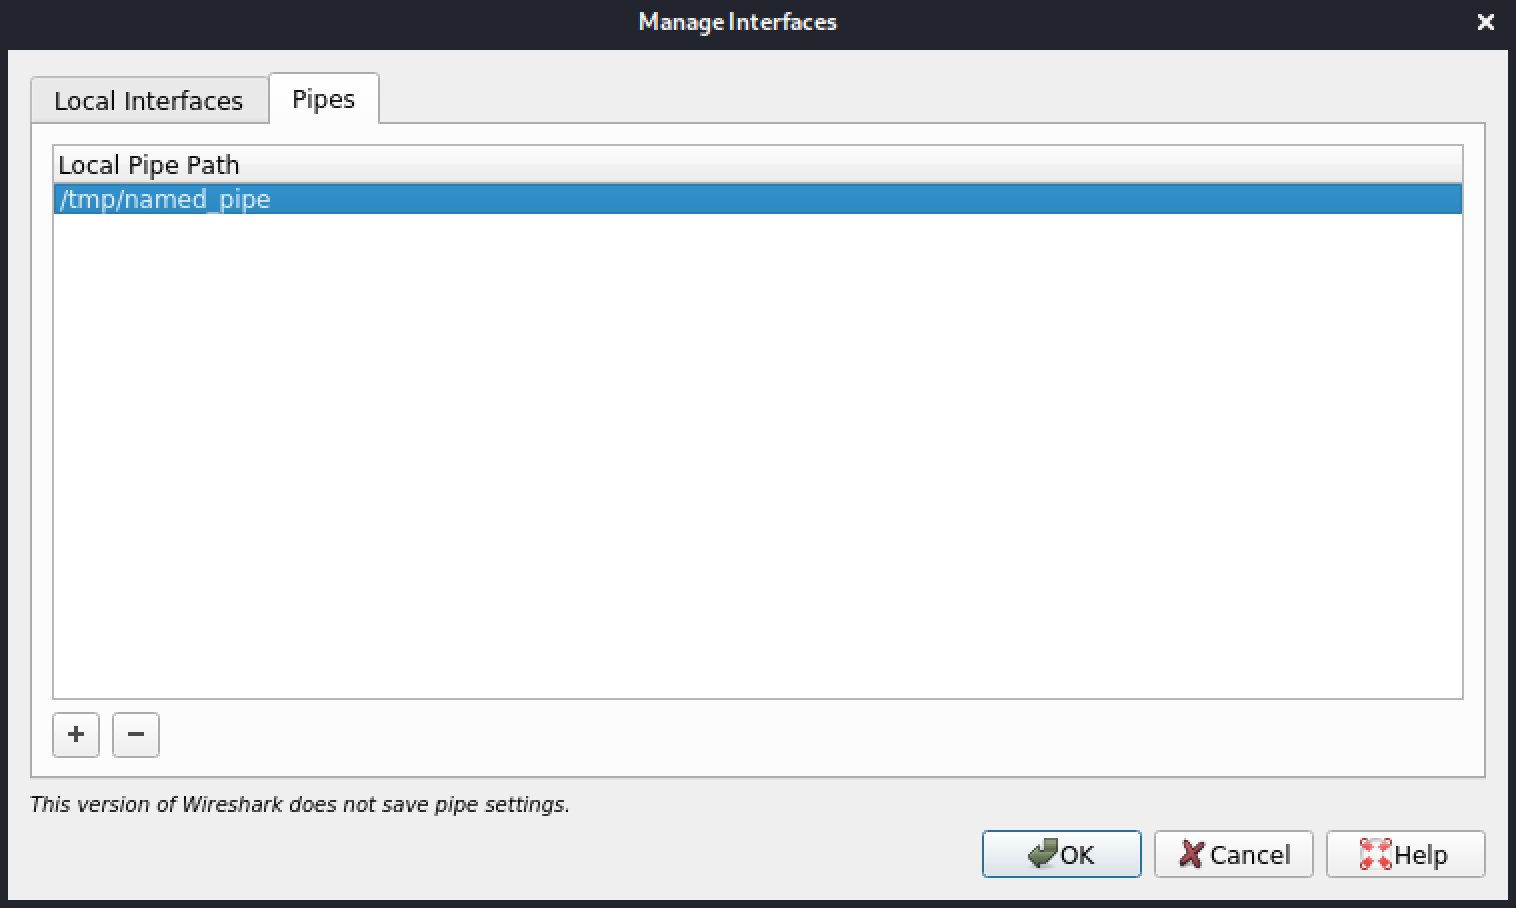
Figure 38: Manage interfaces - Named pipes
Once done, we click OK and the pipe is added to the interface list.
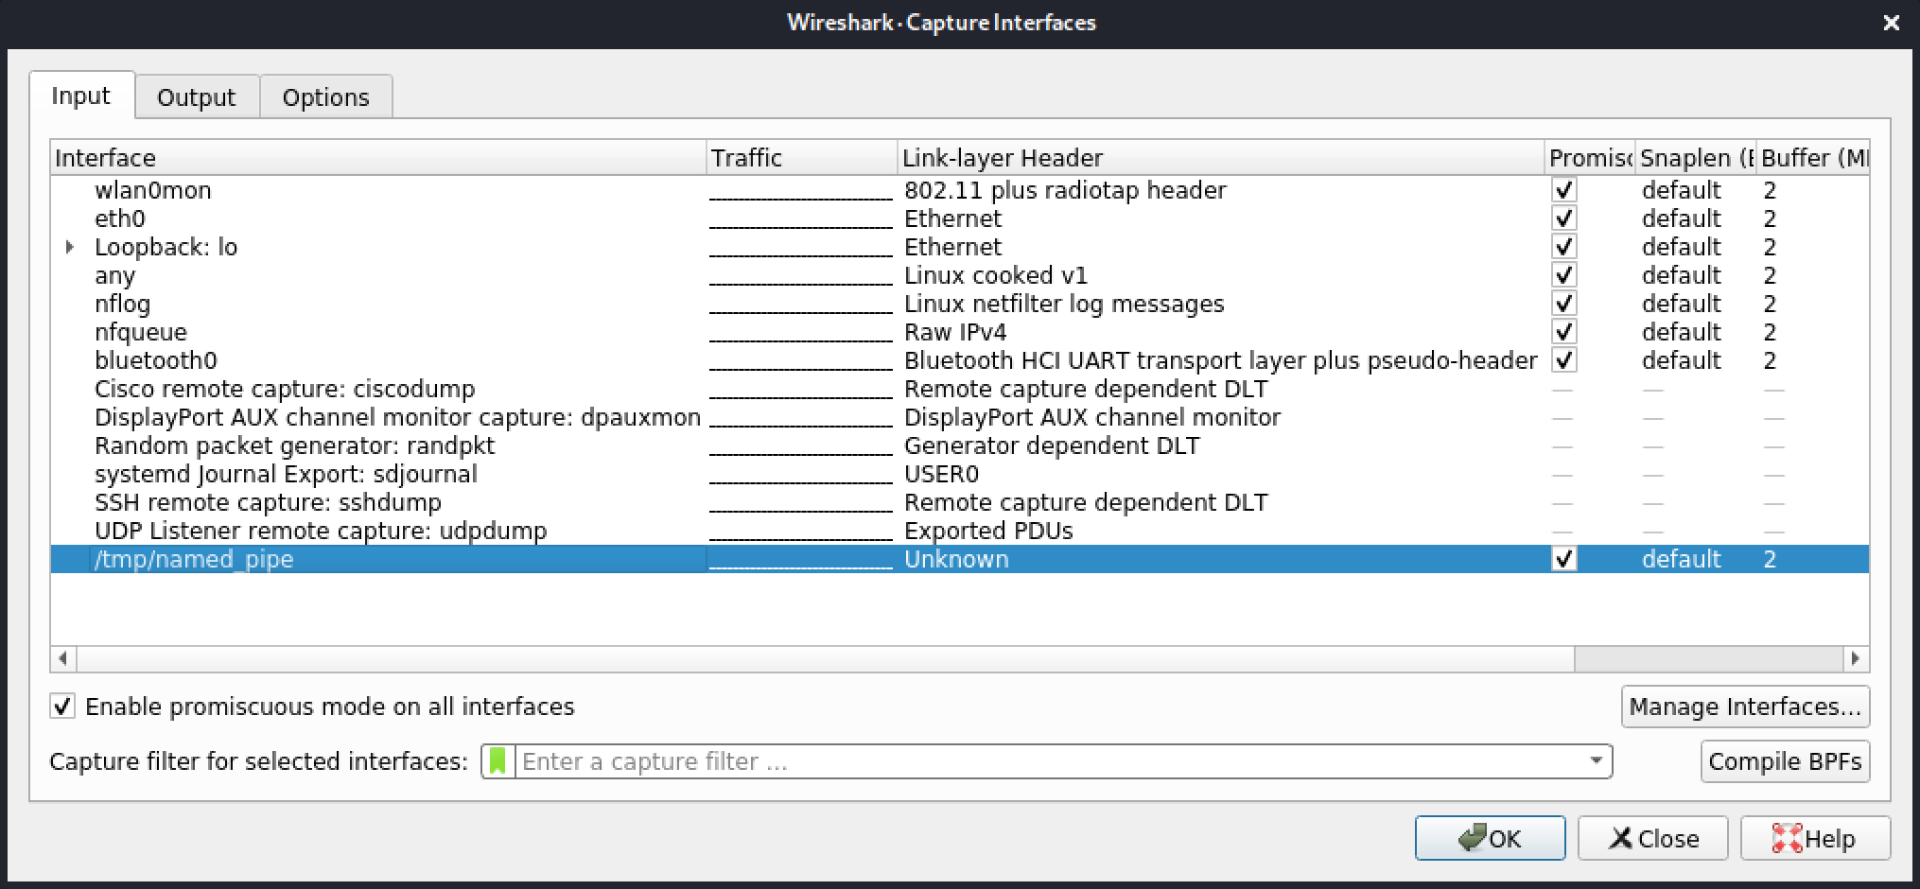
Figure 39: Capture interfaces list with added named pipe
Let's select the named pipe and click Start. Again, Wireshark will not display wireless packets until a capture tool writes data to the named pipe.
Let's initiate the packet capture in a terminal.
Listing 23 - Starting capture on wlan0mon and sending data to the named pipe
The wireless packets will now be displayed in Wireshark.
To summarize, the difference between the two pipe methods is the unnamed pipe writes the capture tool data directly into Wireshark. On the other hand, Wireshark uses the named pipe as an interface and then the capture tool data is written to the named pipe.
Run the Command Remotely
Now that we have a good foundation, let's see how it looks when we actually involve a remote system where we have SSH access. SSH is versatile, and while it is useful for administrating remote systems with an interactive shell, it also has the ability to run a command, display the output on STDOUT, and then exit.
With a remote system's wireless interface in monitor mode, initiating a remote capture is just a matter of putting the pieces together with an SSH session.
First, we connect to the remote system with the SSH command followed by our tcpdump command. Then we pipe this into wireshark.
It is always a good idea to enclose the command in double quotes to make sure the parameters don't accidentally become SSH parameters.
kali@kali:/$ ssh root@10.11.0.196 "sudo -S tcpdump -U -w - -i wlan0mon" | sudo wireshark -k -i -
QStandardPaths: XDG_RUNTIME_DIR not set, defaulting to '/tmp/runtime-root'
root@10.11.0.196's password:******
tcpdump: listening on wlan0mon, link-type IEEE802_11_RADIO (802.11 plus radiotap header), capture size 262144 bytes
Listing 24 - Capturing traffic with tcpdump on remote host and piping it to Wireshark
Once we execute the command, Wireshark starts on our local machine and the terminal prompts for the remote system's SSH password. After entering the password, captured data is written to Wireshark, which displays the wireless frames as they arrive.
Exercises
- Using an unnamed pipe, execute tcpdump with your wireless device and direct it to Wireshark.
- Using a named pipe, execute tcpdump with your wireless device and direct it to Wireshark.
- Initiate a remote SSH tcpdump command and pipe the capture to Wireshark. This may be executed via localhost, to another virtual machine, or to another system on which you have SSH access.
1 (Wikipedia, 2021), https://en.wikipedia.org/wiki/Single-board_computer ↩︎
2 (Brandon Wamboldt, 2014), https://web.archive.org/web/20210424033800/https://brandonwamboldt.ca/how-linux-pipes-work-under-the-hood-1518/ ↩︎
3 (Jyoti Singh, 2018), https://web.archive.org/web/20200429051020/https://www.embhack.com/pipe-and-fifo/ ↩︎
4 (Wireshark Foundation, 2020), https://wiki.wireshark.org/CaptureSetup/Pipes ↩︎
4.4.2. Built-in Wireshark
Let's review how to do remote packet capture with SSH from within Wireshark. If we've previously isolated our devices to only the wireless interfaces, we can refocus to External Capture devices. We'll select External Capture and then de-select all others in the interface's dropdown menu.
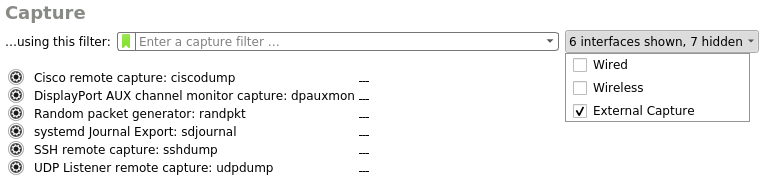
Figure 40: External virtual interfaces in dropdown box
Next, let's click on the cog wheel to the left of SSH remote capture: sshdump at the bottom of the Capture section to open the options window.
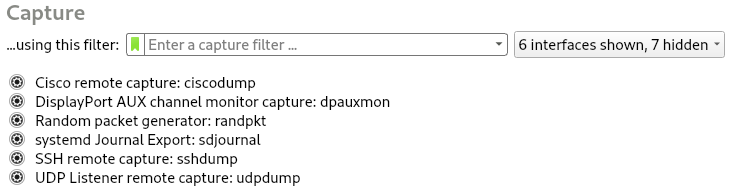
Figure 41: External virtual interfaces
Warning
Wireshark typically captures from interfaces on the local system. These "External Capture" interfaces are using ExtCap,1 which allows executables to be seen as capture interfaces. All of these are separate binaries: ciscodump, dpauxmon, randpkt, sdjournal, sshdump, and udpdump. They provide data in PCAP format and can be found in the /usr/lib/x86_64-linux-gnu/wireshark/extcap/ directory (on a 64bit Kali). Some of these tools have man pages but they all are executed with a few arguments. All of them are similarly configured in the Wireshark GUI.
On this first screen, let's configure the IP address of the remote host. The Remote SSH server port field is required, so we'll enter the default of port 22.
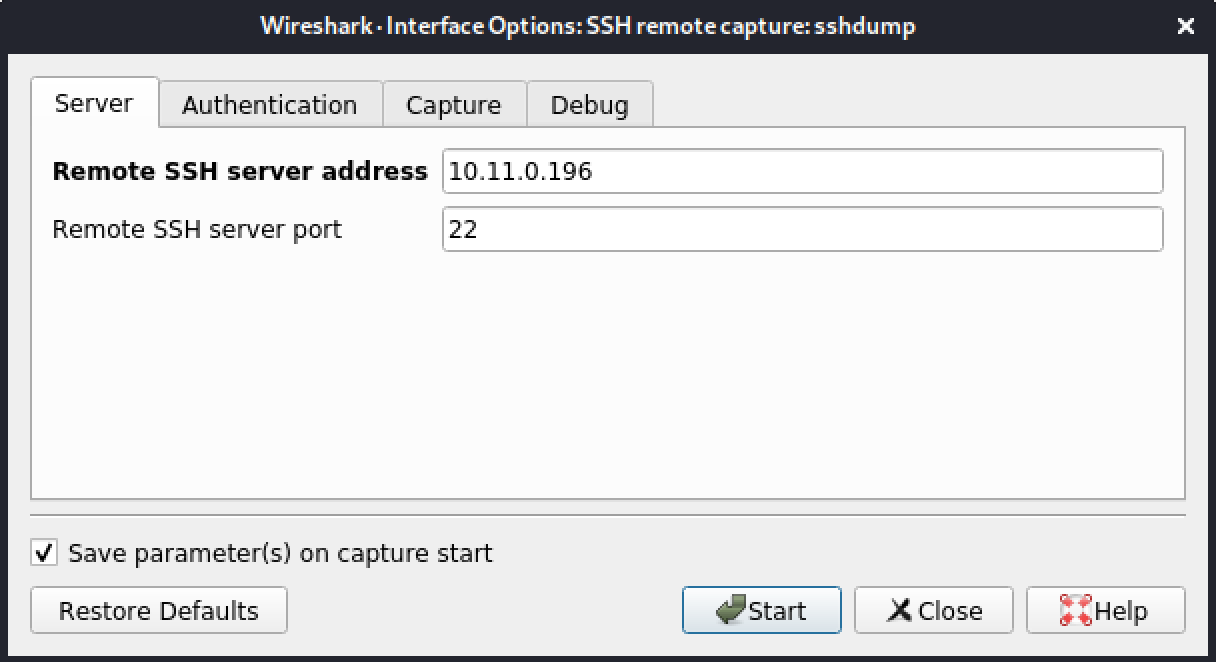
Figure 42: SSHdump - Server tab
On the Authentication tab, we enter the SSH credentials for the remote host. SSHdump handles both password-based authentication and key-based authentication.
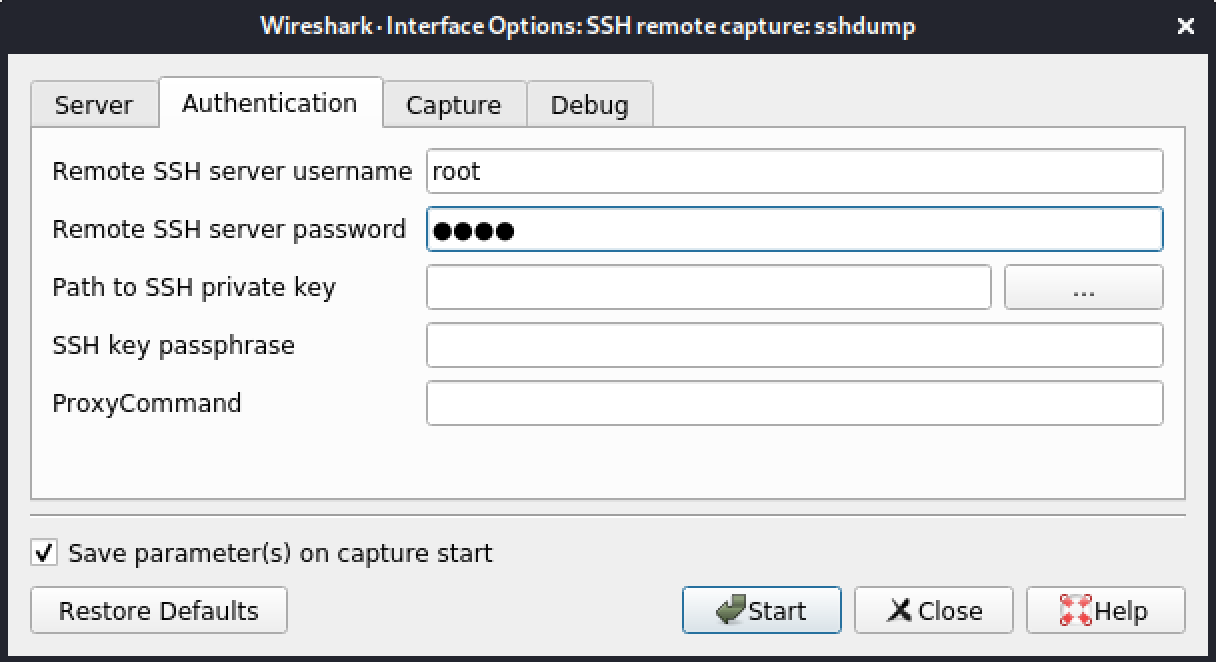
Figure 43: SSHdump - Authentication tab
SSH key-based and ProxyCommand authentication are also options, but we will confine our capture to using a username and password.
In this example, we are authenticating to the remote system as root. To use a standard user instead, you will need to run 'sudo dpkg-reconfigure wireshark-common / yes' to reconfigure the wireshark package and 'sudo usermod -a -G wireshark kali' to add the user (kali in this example) to the wireshark group
Next, we enter the required parameters in the Capture tab.
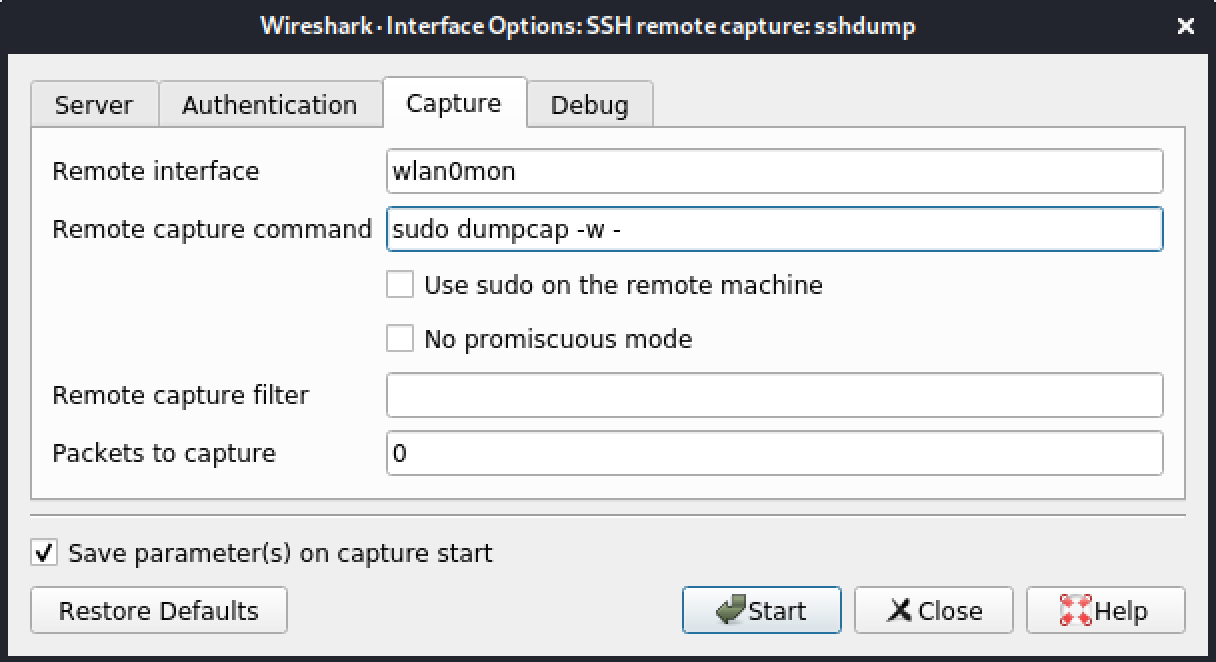
Figure 44: SSHdump - Capture tab
The SSHDump tool is basically an application that builds an sshdump command line argument. The Remote interface textbox is the equivalent of appending -i wlan0mon in the Remote capture command textbox.
The user on the remote system must be able to either initiate a capture or have access to sudo. If it's the latter, check the Use sudo on the remote machine checkbox.
In this example, we will use dumpcap to minimize CPU usage, although we could use any capture tool as long as it is available on the remote capture device.
The last tab is to enable debugging and to specify where to save the log messages in case we encounter errors.
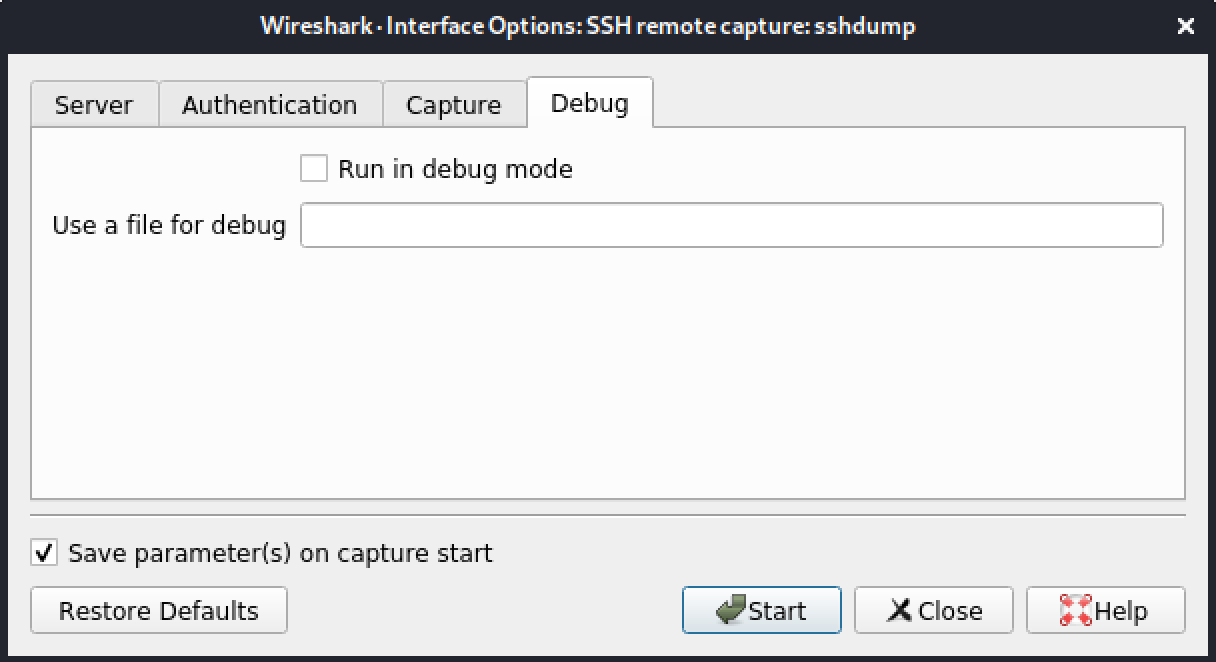
Figure 45: SSHdump - Debug tab
Once ready, we click Start. If the parameters are correct and the remote system is reachable, the capture will start shortly.
When Save parameter(s) on capture start is checked, the next time SSHdump is used, it won't prompt for settings and will start automatically. If the settings are not properly set and an error results, Wireshark does not make resetting to the defaults easy. They can be reset via Edit > Preferences... > Advanced. In the resulting Search: textbox, we type "sshdump". Then double click every modified parameter (anything in bold) to set SSHDump back to the default values. Click on OK and SSHDump is back to its default configuration.
Exercise
Using Wireshark's SSH option, initiate a dumpcap capture on a remote system. This may be executed via localhost, to another virtual machine, or to another system on which you have SSH access.
1 (Wireshark Foundation, 2021), https://www.wireshark.org/docs/man-pages/extcap.html ↩︎
4.5. Advanced Preferences
Wireshark has a large number of available options that we can configure to improve our workflow. In the next few sections, we will cover some of the more common preferences that we use.
4.5.1. Coloring Rules
To make analysis easier, we can apply colored highlights to packets in the packet list. In order to turn colors on or off, we will toggle View > Colorize Packet List. We can edit the rules under View > Coloring rules.
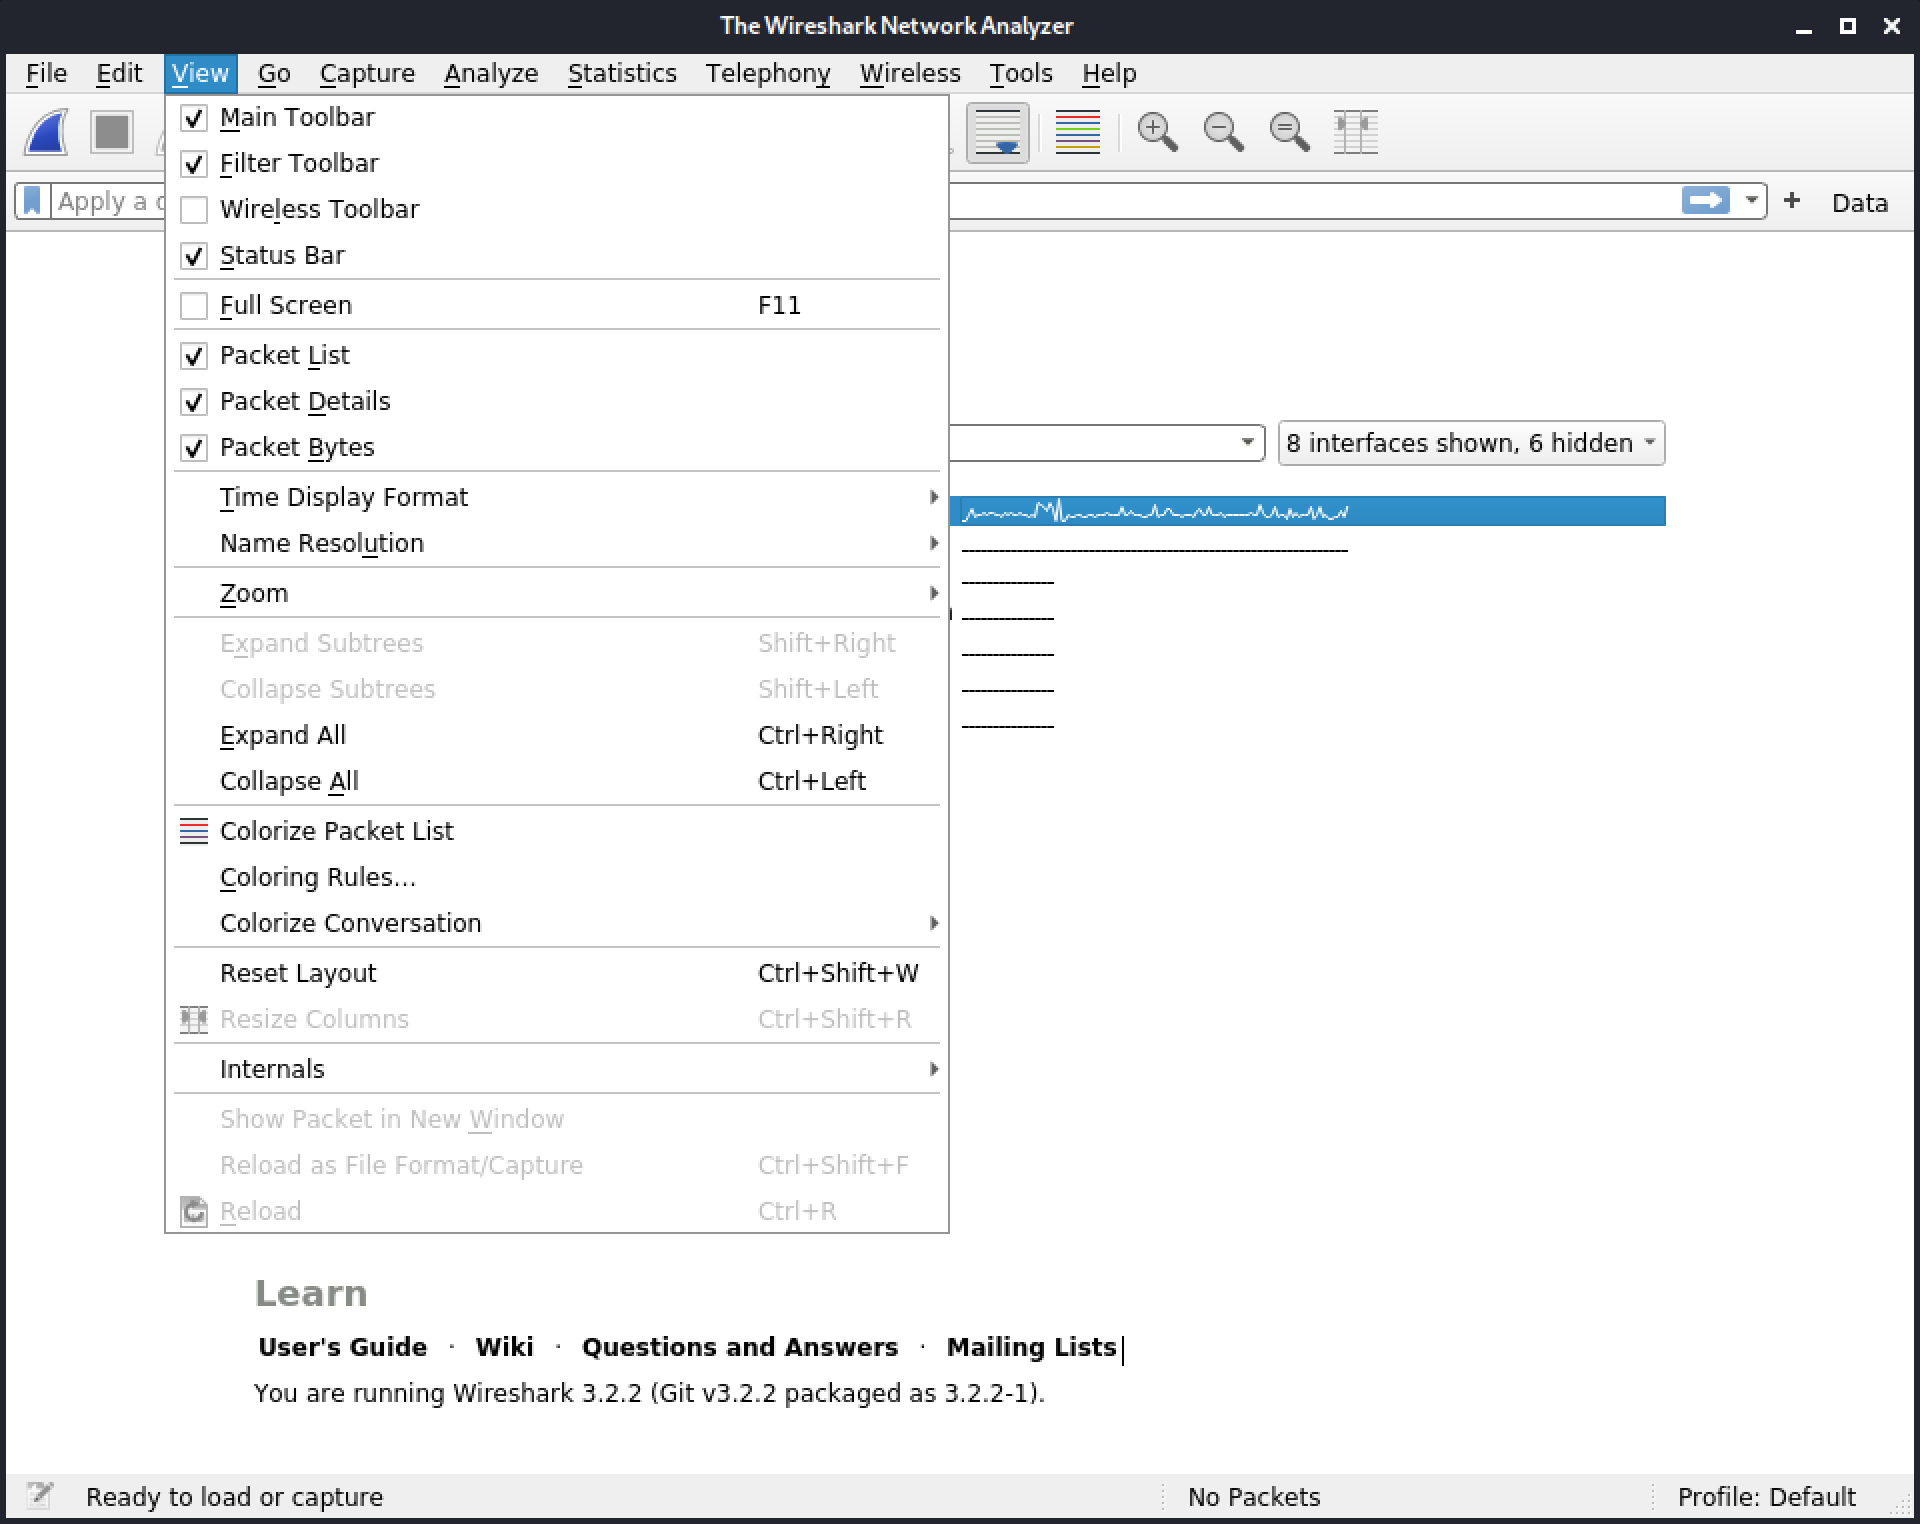
Figure 46: Coloring rules menu
Wireshark's default coloring rules are mostly for Ethernet networks, but we can add additional rules for wireless frames.
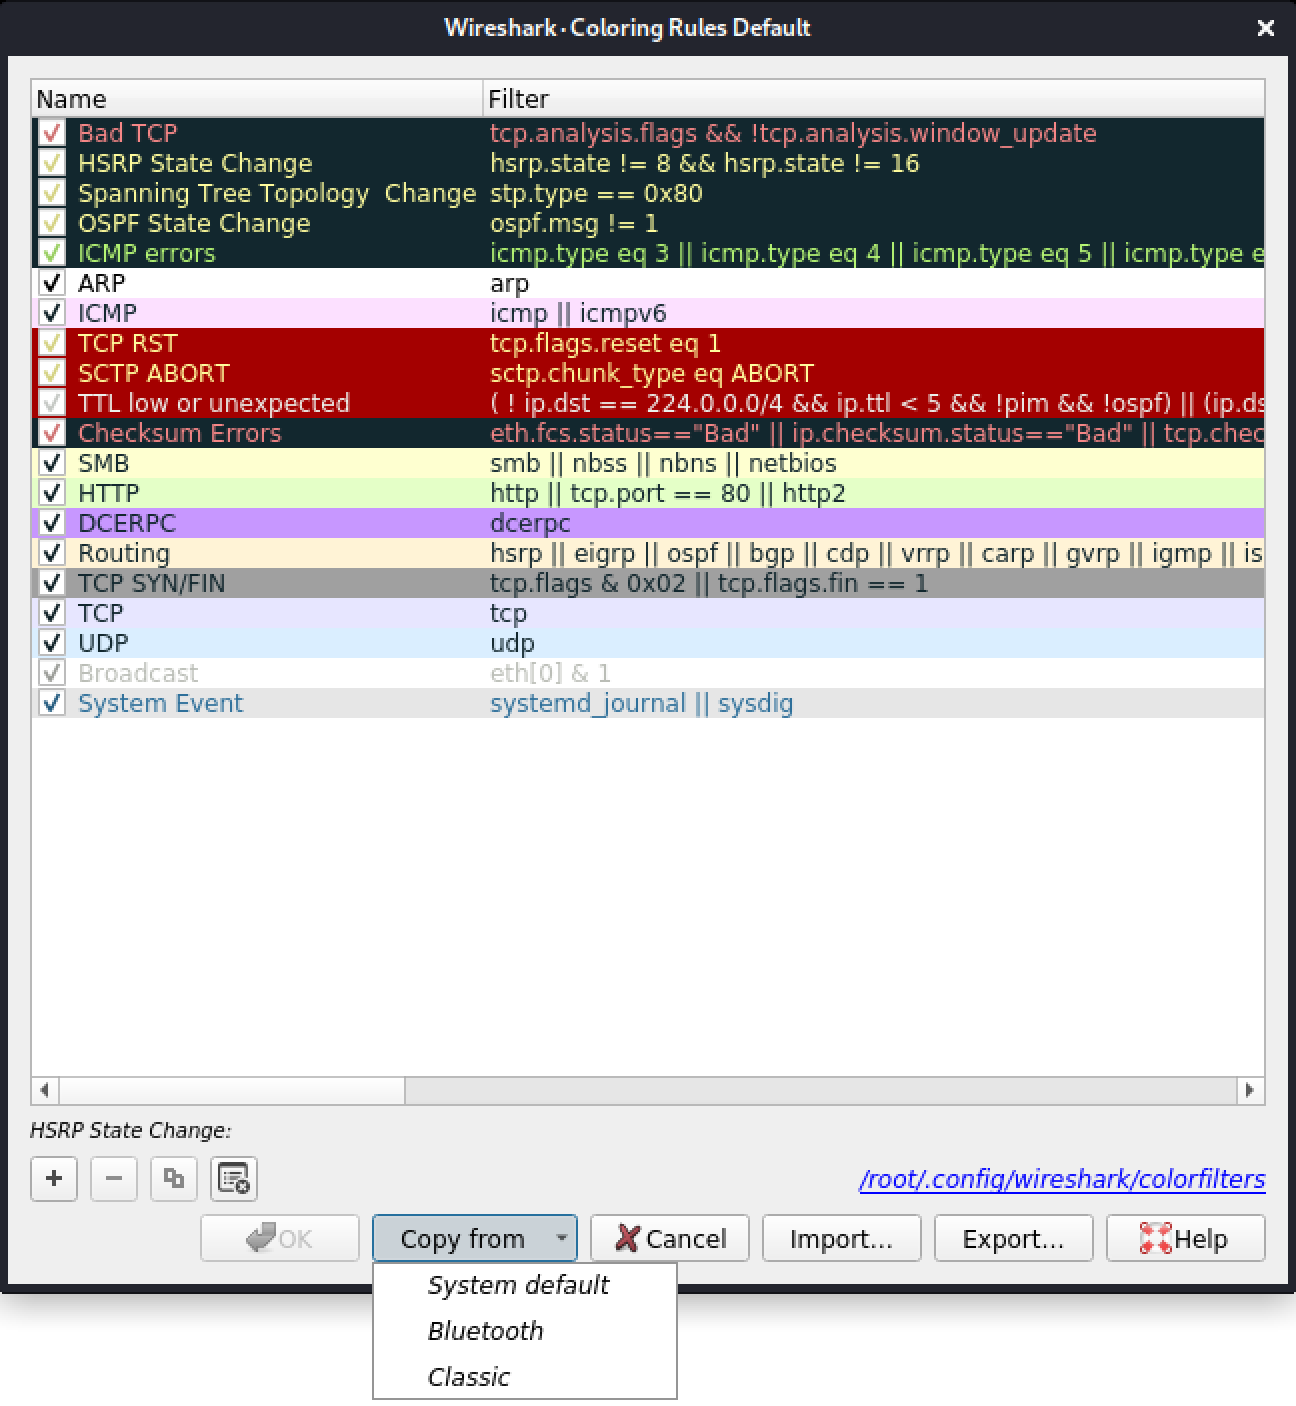
Figure 47: Coloring rules
Wireshark processes the rules in order until a match is found, applies the coloring, then stops. It also skips disabled (unchecked) rules.
In order to add a rule, we will click on the + button, fill in the display filter, and name it. To select colors, we simply click on the boxes containing Foreground (for the font color) and Background where we can either use the preselected colors or use the color picker to add different ones. Once we click OK, we should see the colors applied to the current capture as long as we remembered to check the View > Colorize Packet List option.
The red X button will delete the currently selected rule, and the button next to it will duplicate the currently selected rule. The following button clears the whole list. Moving the rules around is just a matter of clicking on them and moving them up and down.
Rather than creating a series of rules, one easy option is to import a wireless coloring rules file from the Wireshark coloring rules wiki.1 To do this, we will download and save the file to the system, select Import..., browse to the color rules file, and select Open. Once we see the new wireless rules displayed with the default color rules, we can select OK to apply them.
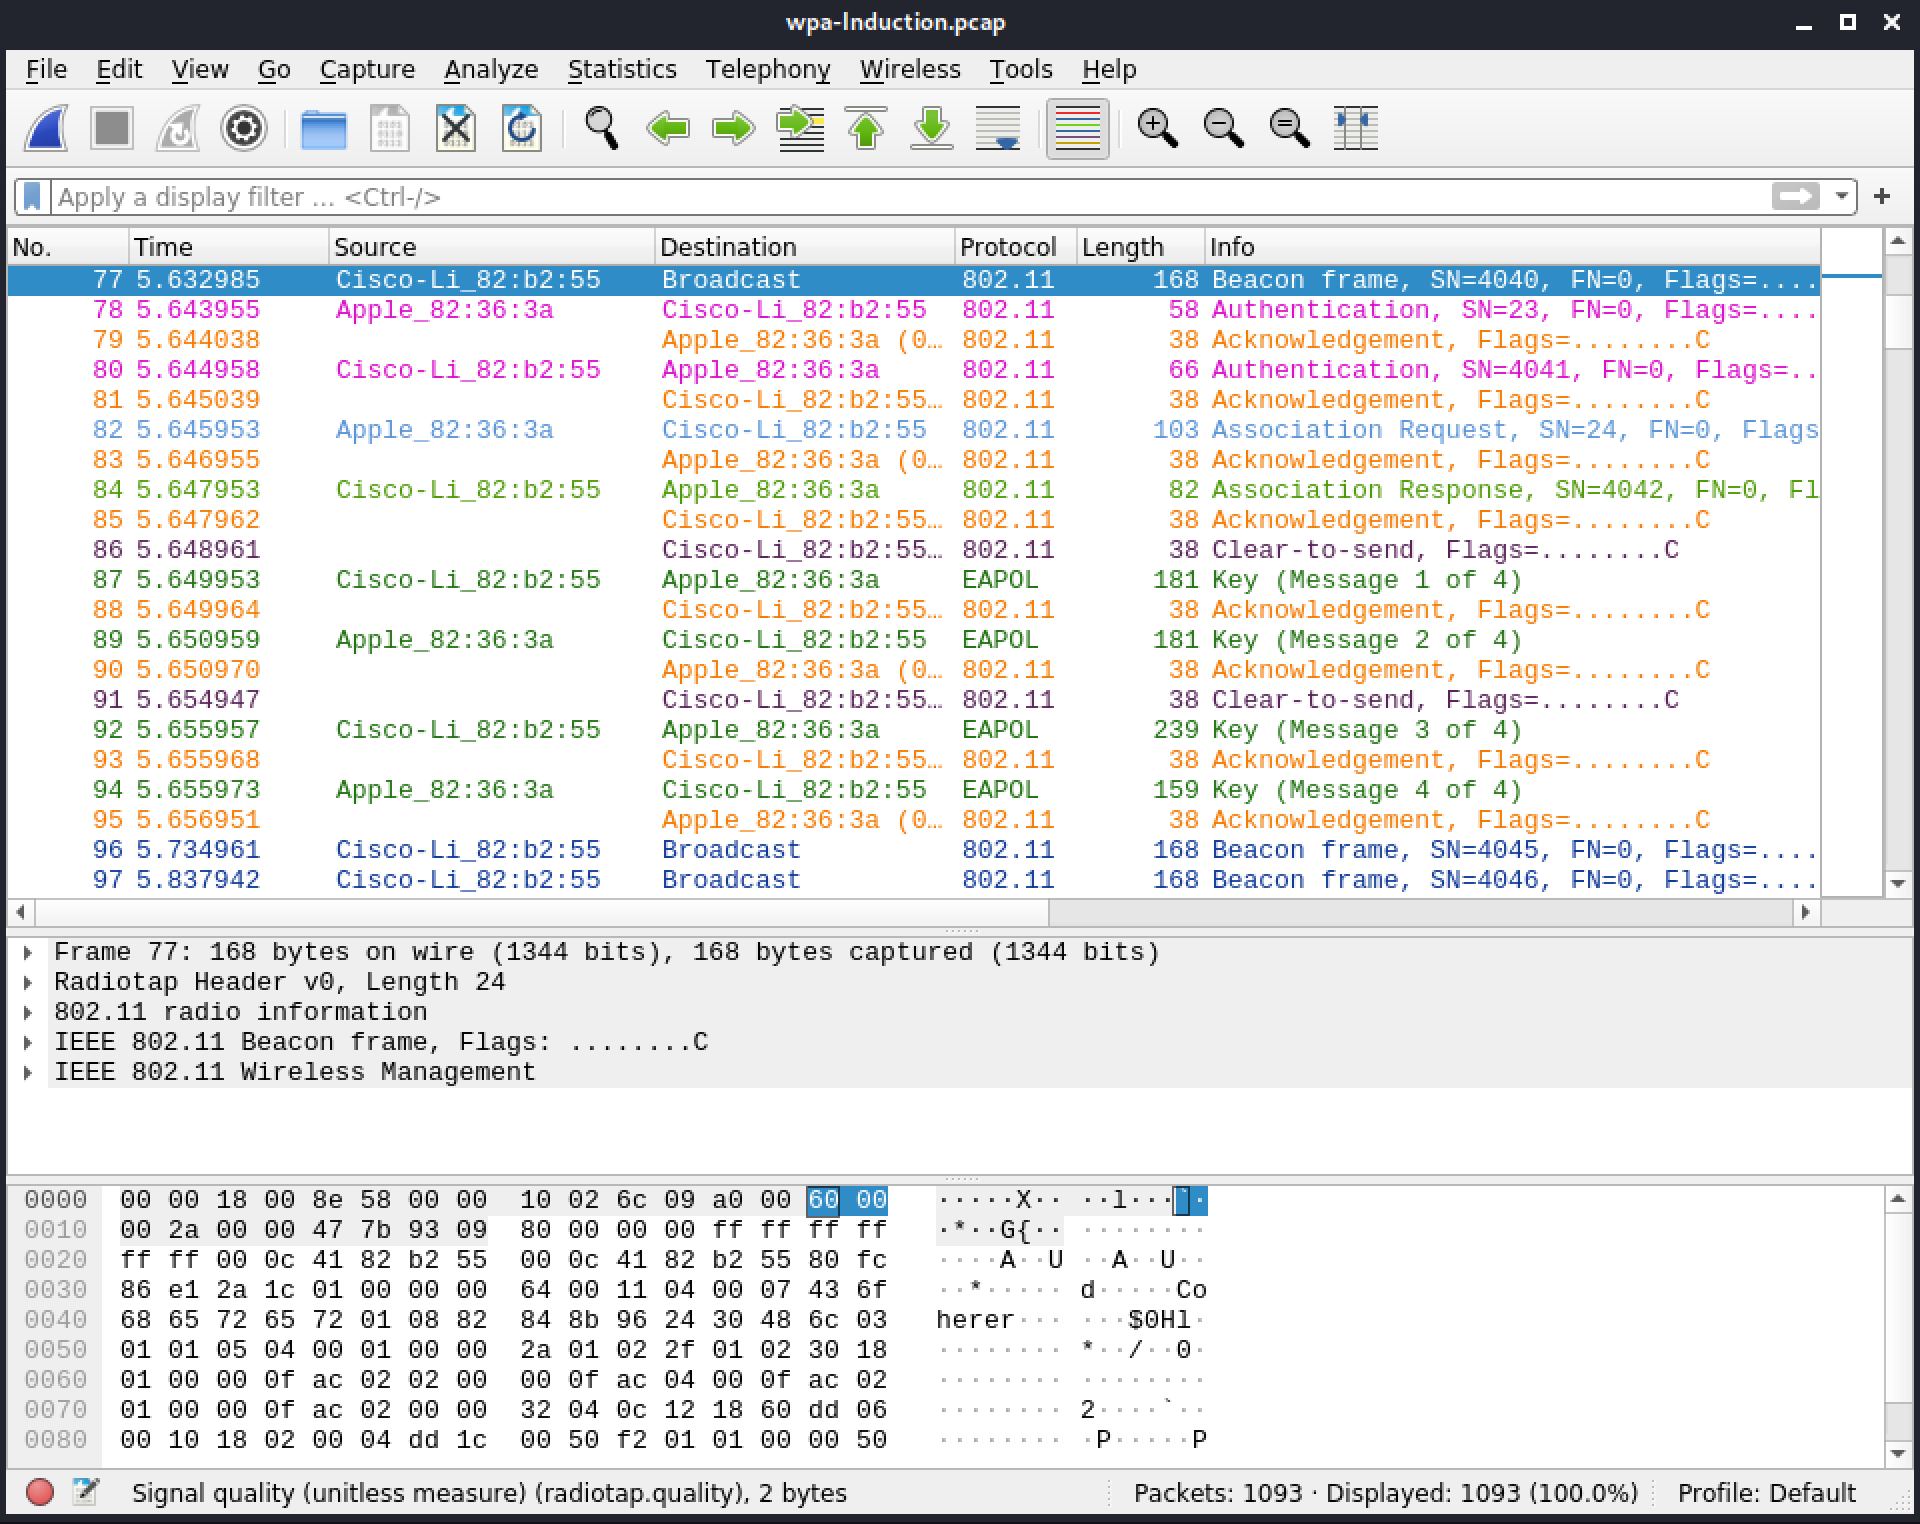
Figure 48: Packet list using coloring WLAN rules
It's much easier to quickly notice important traffic thanks to the coloring. Now, looking at the traffic flowing, we recognize the types of frames of interest. Coloring reassociation, authentication, deauthentication, disassociation, eapol, eap, etc., makes them stand out. We can also use the color rules to analyze traffic.
1
(Wikipedia, 2015), https://wiki.wireshark.org/ColoringRules ↩︎
4.5.2. Wireshark Columns
If we'd like, we can move, resize, remove, hide, and add new columns in the Wireshark Packet List.
We can create a column from any item of interest from within a packet. For example, we can add a channel column from a probe request packet. Let's expand the 802.11 radio information field, right click Channel 11, and select Apply as a column.
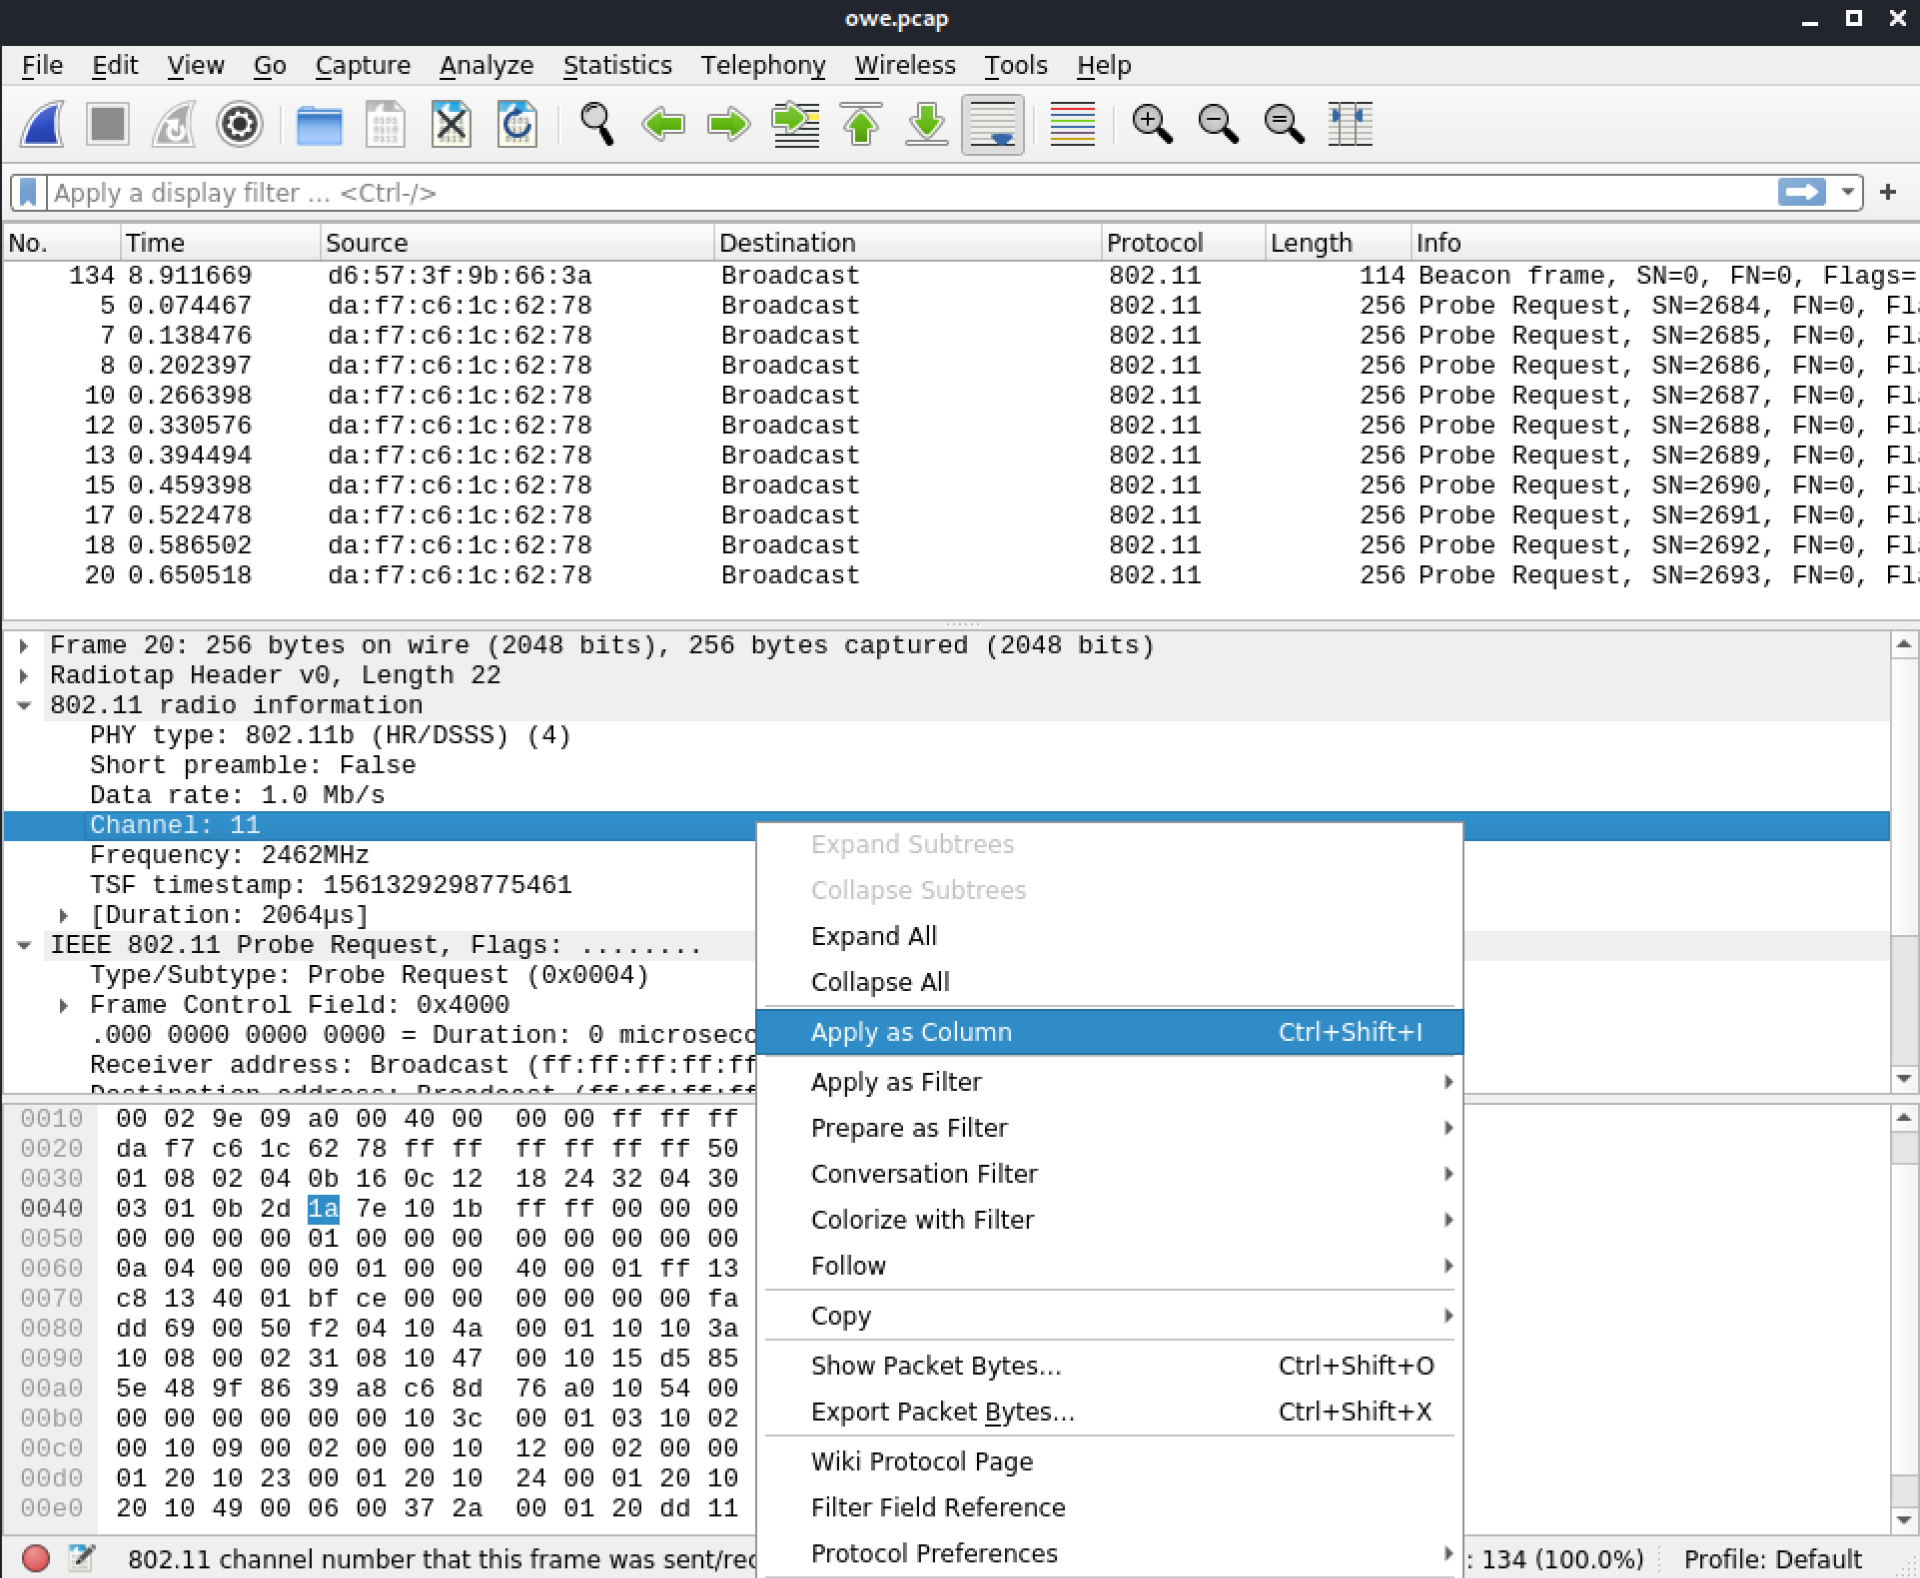
Figure 49: New column added from 802.11 radio information
We can see the Channel column appear in the Packet List window. We can also create a column by selecting the item and then selecting Analyze > Apply as a column.
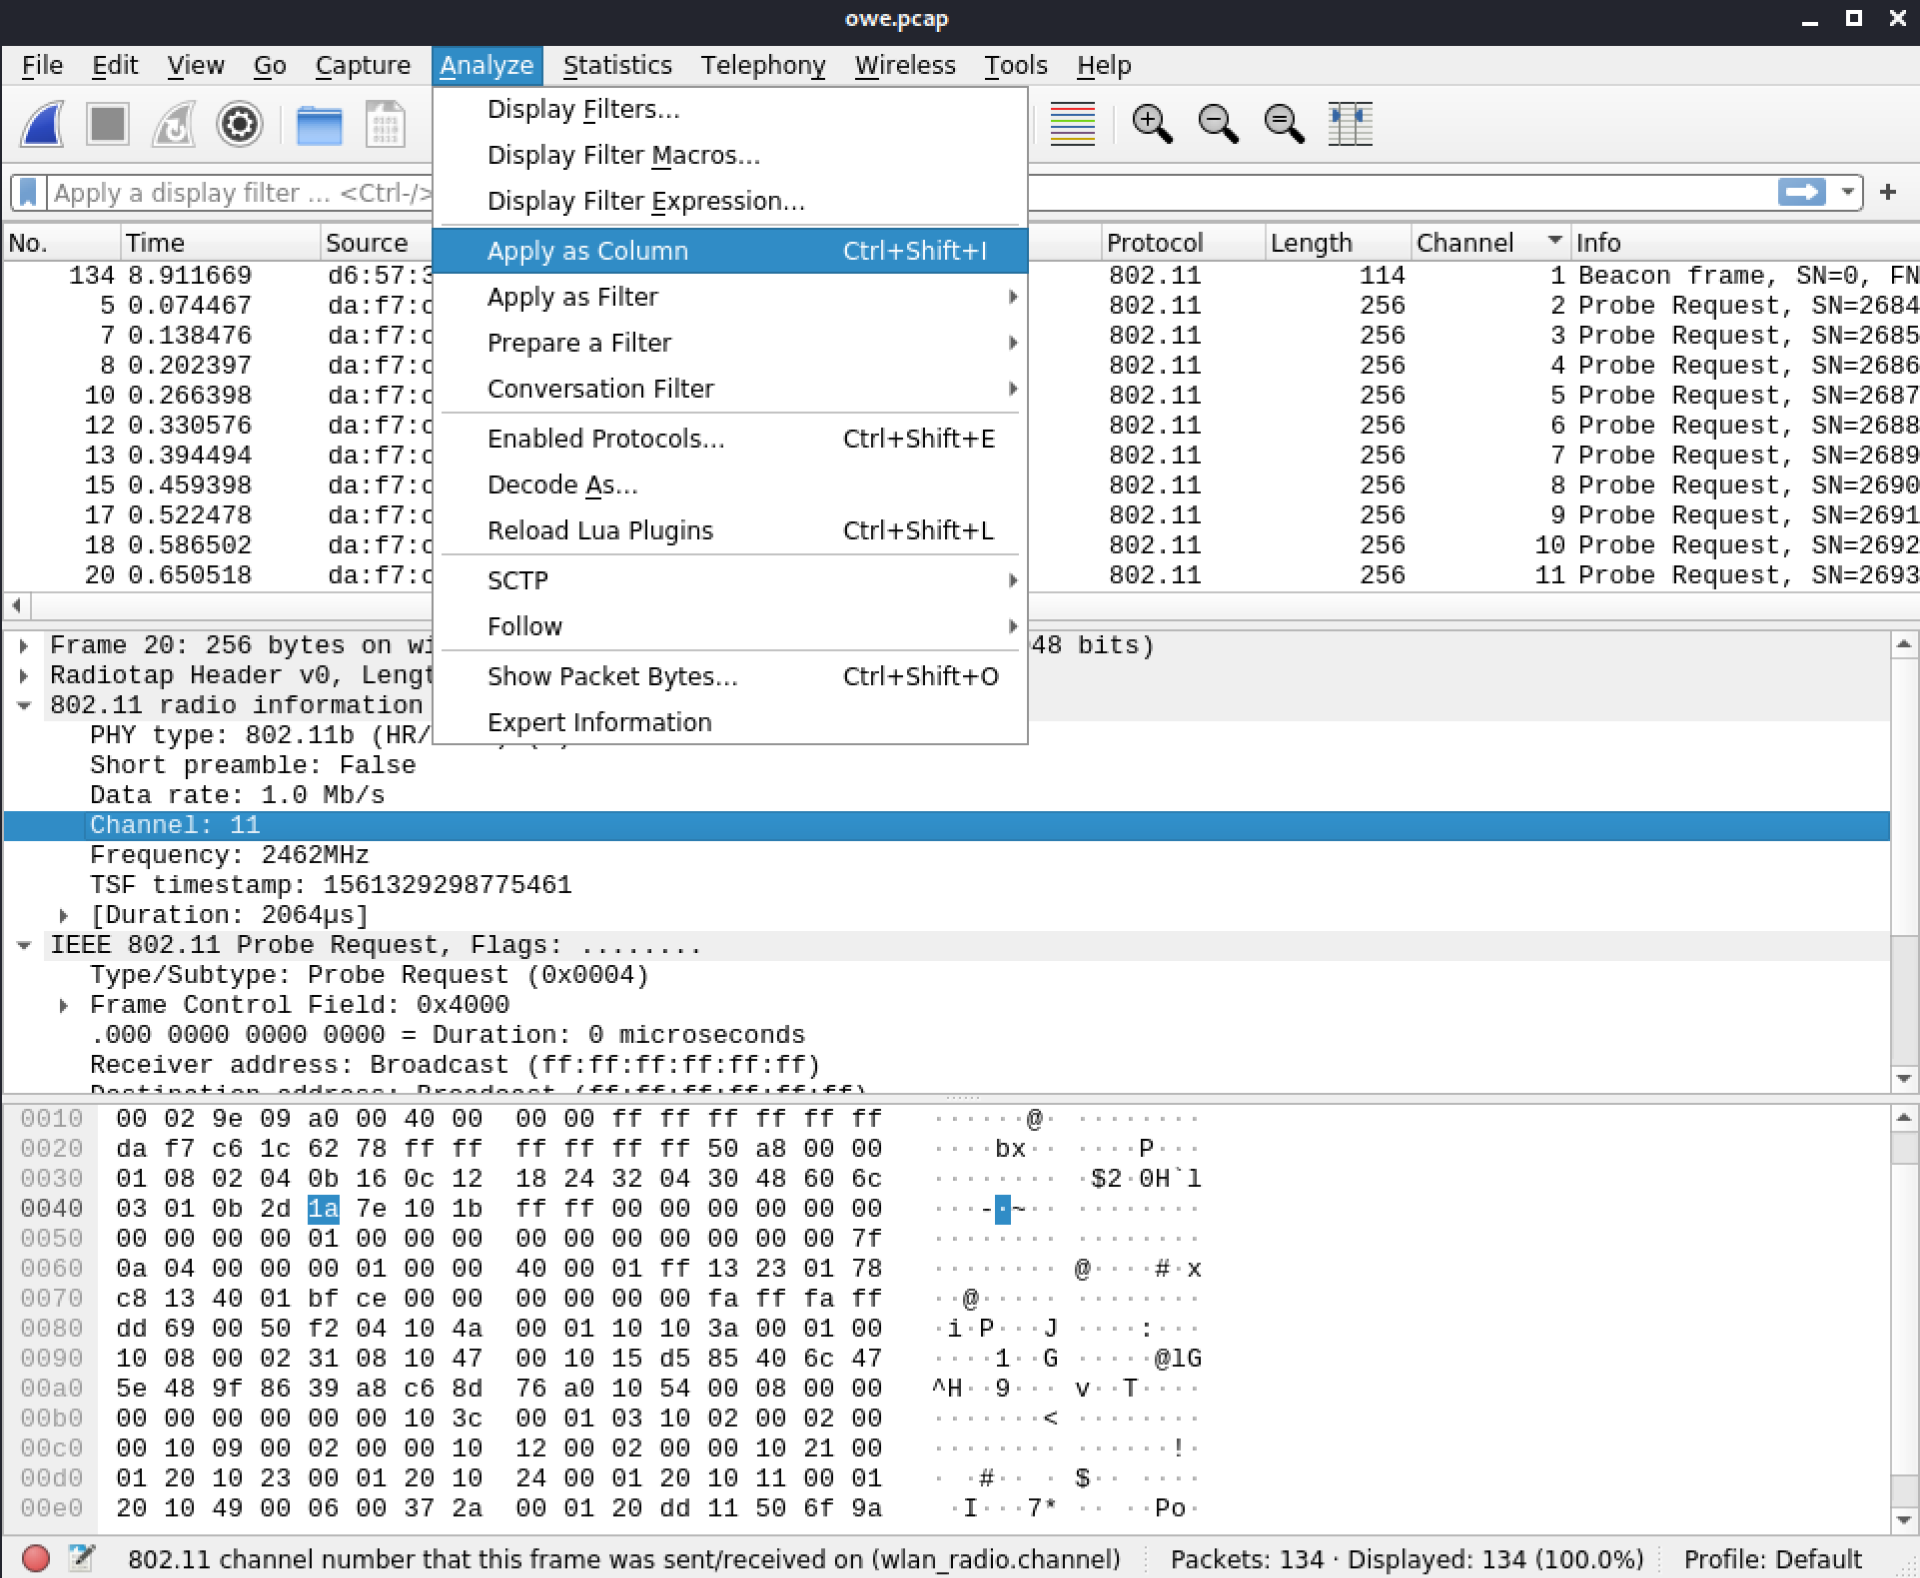
Figure 50: New column added from 802.11 radio information
We can move a column by dragging it to the left or the right and then dropping it where we want it.
To remove a column, right-click on the selected column header and select Remove This Column at the bottom of the pop-up menu. Deselecting the column in the section above hides it.
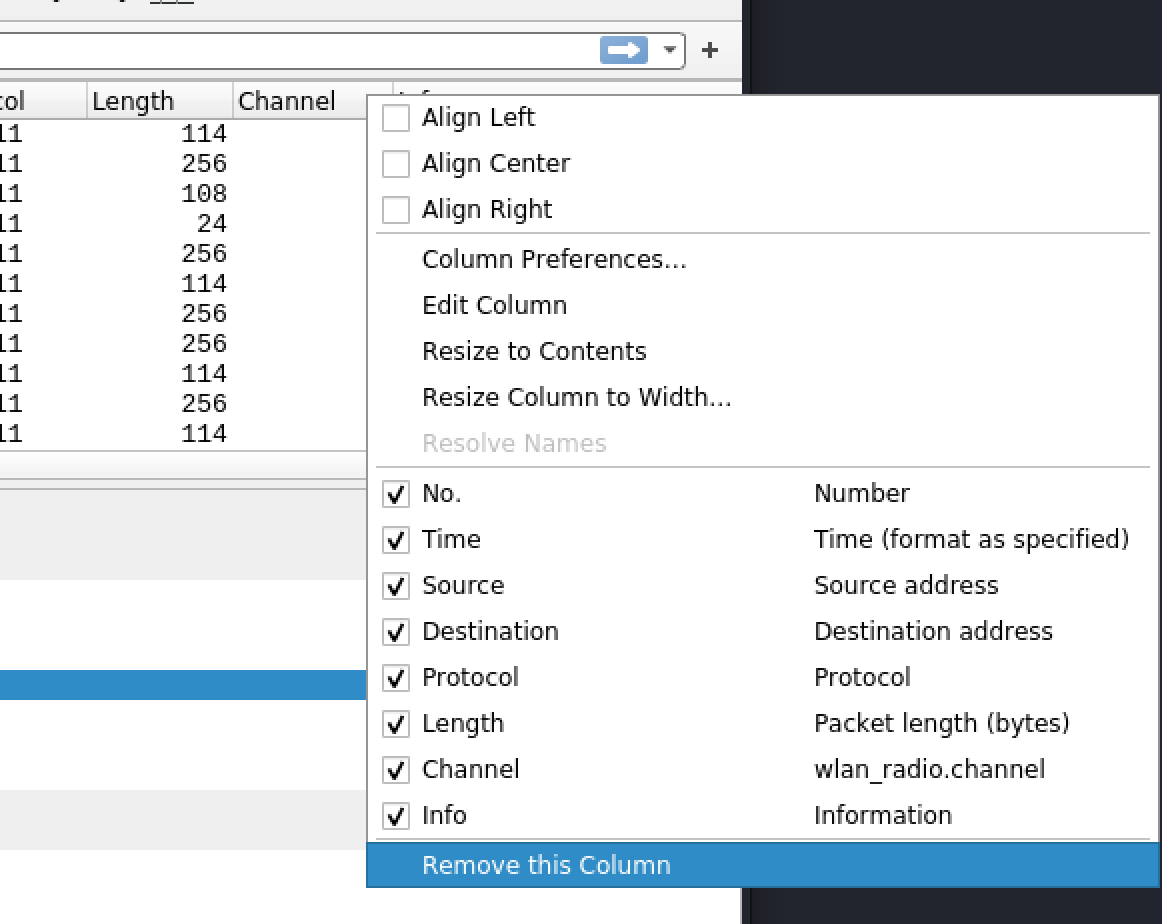
Figure 51: Right click on Channel column
We can also manage columns in Preferences by going to Edit > Preferences.... In the left panel, inside the Appearance item, we will open Columns. Creating and editing a column this way follows the same general principals as before.
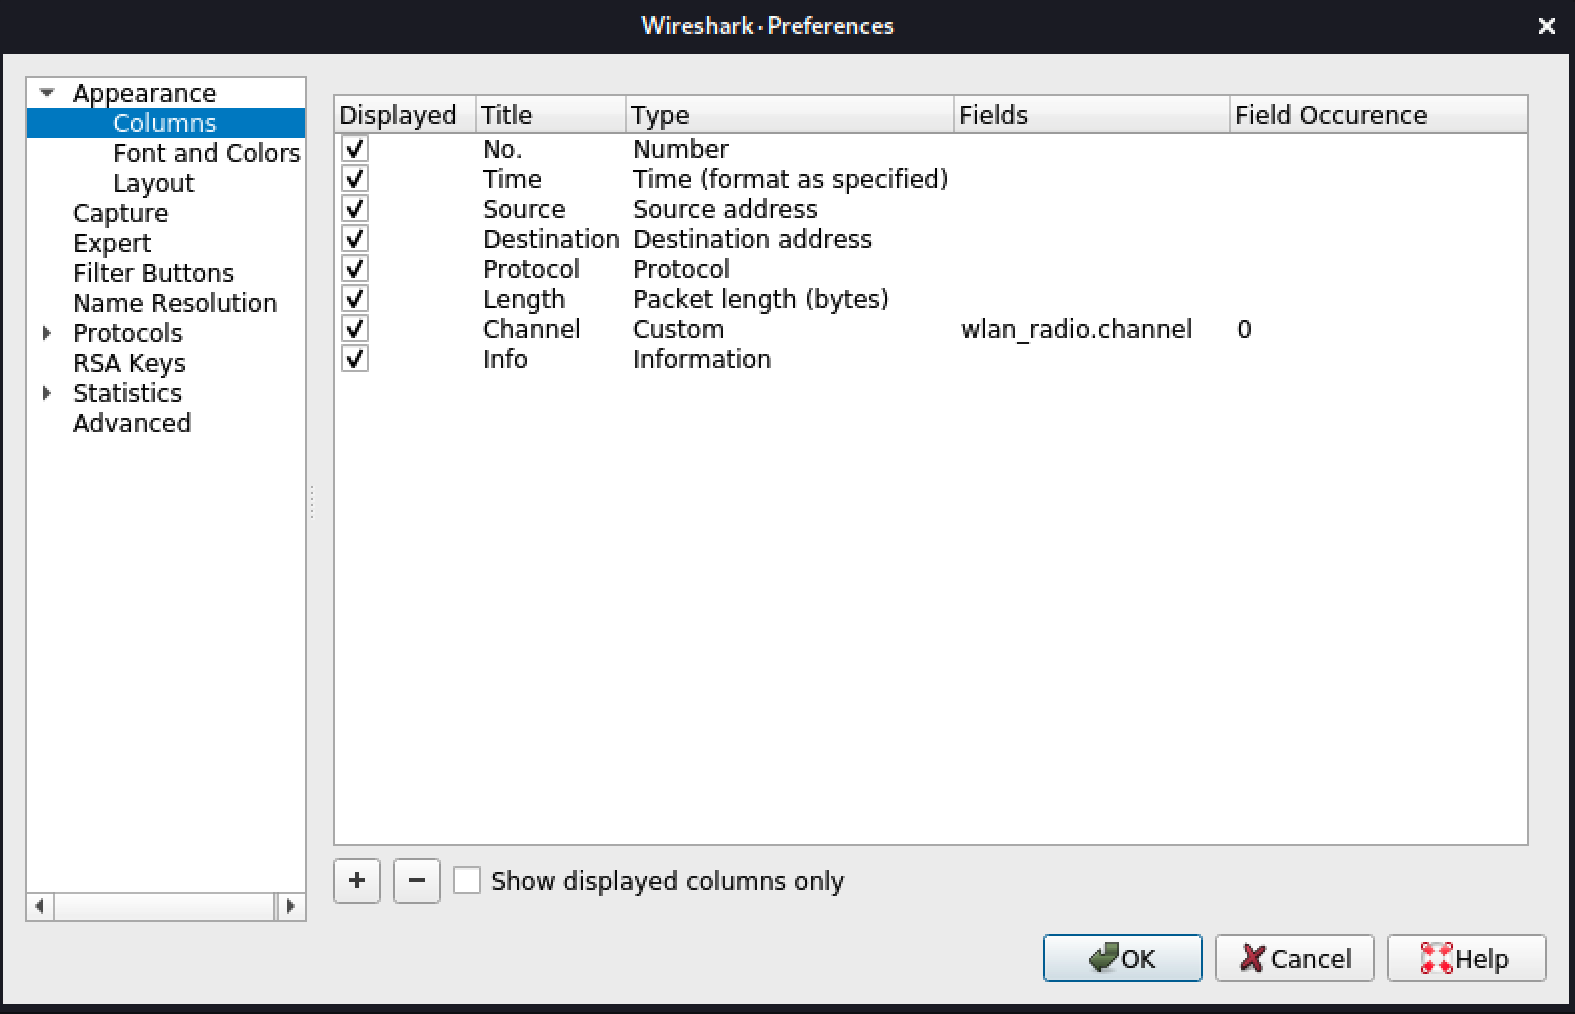
Figure 52: Manage columns in Preferences
4.5.3. Capture snaplen
Setting a snaplen,1 or snapshot length, allows us to limit how much data we capture for each packet. Wireshark, tshark, dumpcap, and tcpdump can all set the snaplen for a capture.
For reasons similar to using a capture filter, snaplen is useful when we are not allowed to capture the entire packet of a target or we don't need the entire payload.
There is one caveat to snaplen. We have to configure it when setting up the capture, and we cannot change it while the capture is running.
Warning
Be careful setting the snaplen value. Wireless frame headers can vary in length due to the DLT (whose size varies across drivers), QoS,2 and encryption. We will need to set the snaplen value appropriately to avoid cutting the packet too short. We will invariably get the first few bytes of some packet payloads.
The Wireshark snaplen setting isn't available on the welcome screen. It has to be configured in Capture Interfaces via Capture > Options....
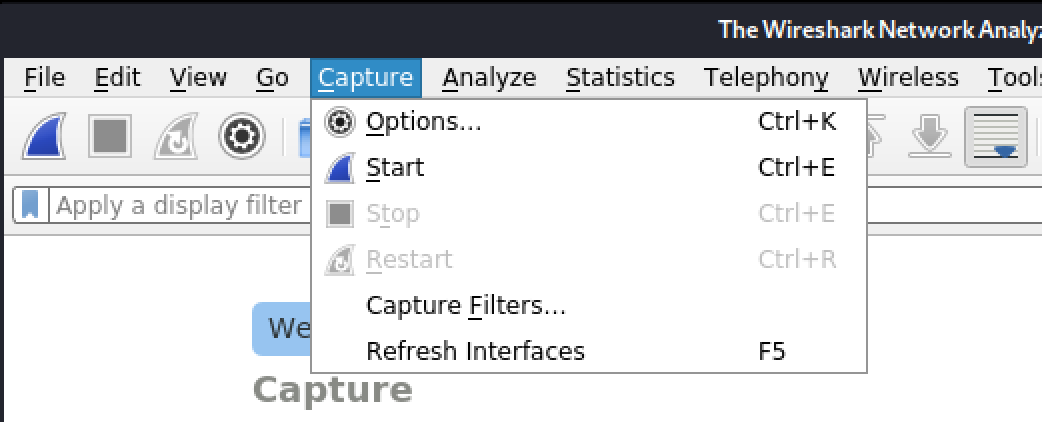
Figure 53: Capture > Options... menu
In the Capture Interfaces screen, we double-click on the default value in the interface's Snaplen (B) column to set its value (in bytes). To capture most frames without their payload, we can add 24 to the size of radiotap headers. Currently, with the wireless card recommended for the course, the size of radiotap headers is 36 bytes, which brings the snaplen to 60.
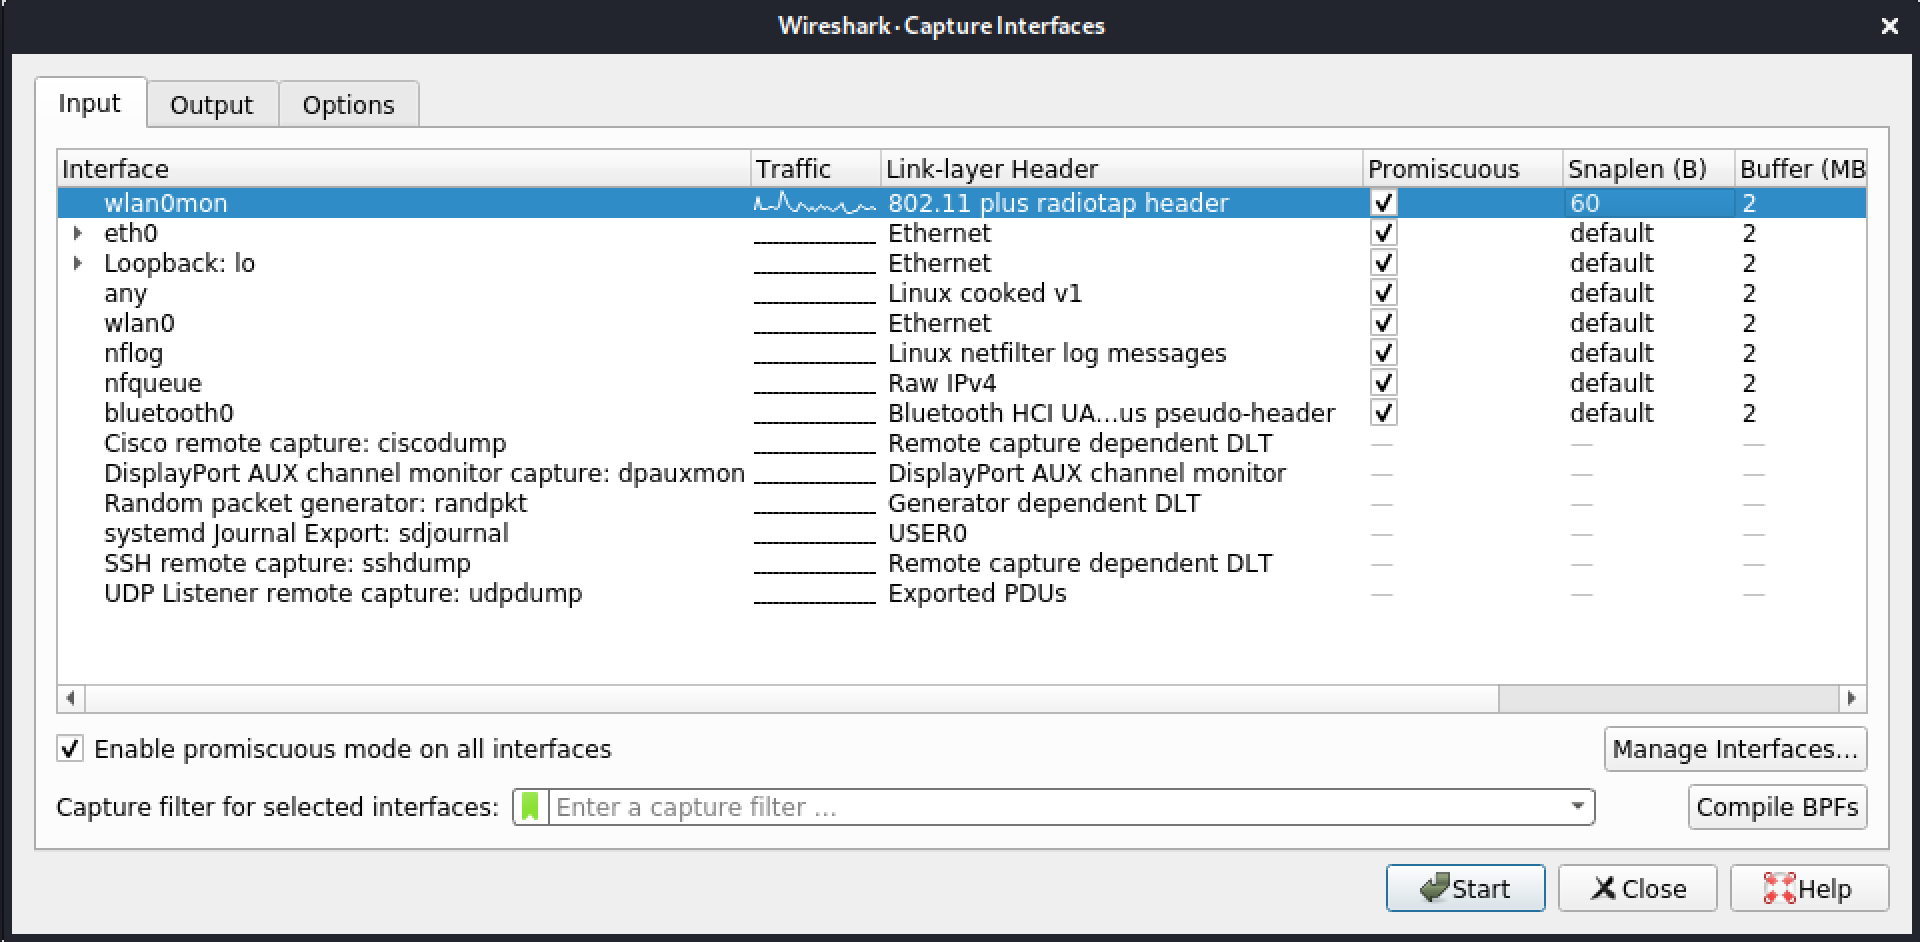
Figure 54: Capture Interfaces - Setting snaplen to 48
To return the capture to the default snaplen value, enter 262144 in the Snaplen (B) field.
Using the command line, the option to set the snaplen is -s followed by the value in bytes. Wireshark, tshark, dumpcap, and tcpdump all use the same command line option.
1 (Wireshark Foundation, 2010), https://wiki.wireshark.org/SnapLen ↩︎
2 (mrn-cciew, 2014), https://mrncciew.com/2014/10/13/cwap-802-11-data-frame-types/ ↩︎
4.5.4. IEEE 802.11 Preferences
In the IEEE 802.11 protocols, we can change various settings regarding 802.11.
As we've seen before, we can access preferences through the shortcut on the right of the wireless toolbar or via Edit > Preferences, then expanding Protocols and clicking on IEEE 802.11.
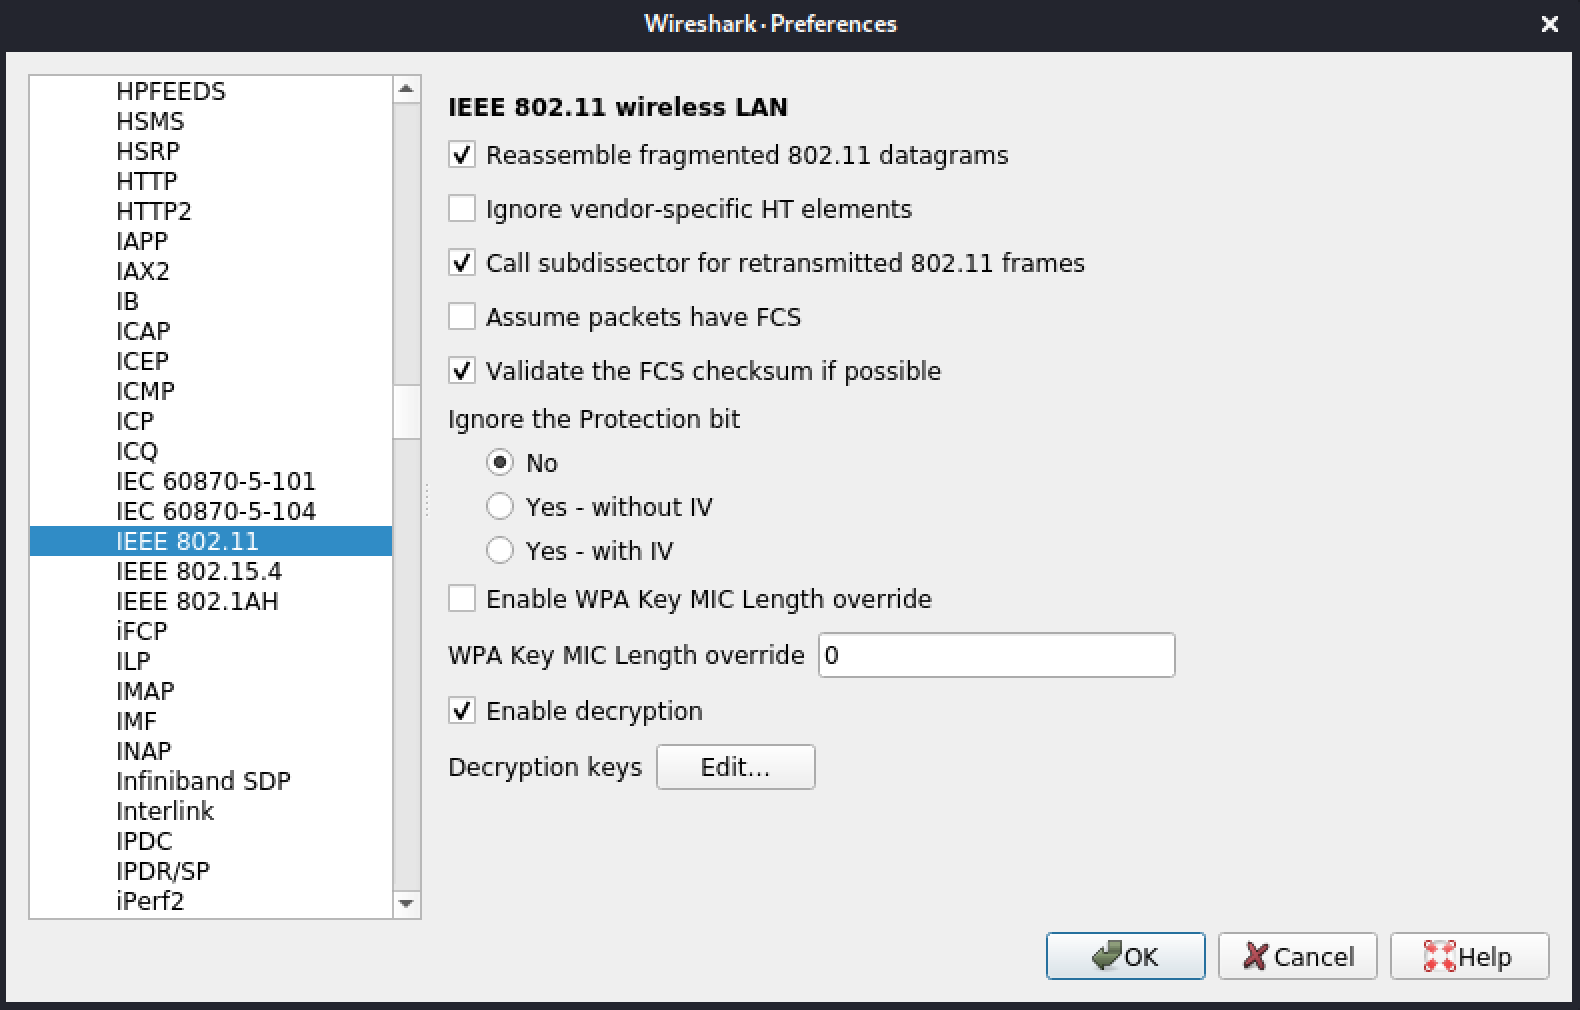
Figure 55: 802.11 preferences
When we hover the mouse over the different checkboxes and radio buttons, Wireshark displays helpful hints.
While some options are geared toward dealing with things like old driver bugs, a few may be useful. When we receive a large amount of data, CPU usage will rise. To save on CPU usage, we can disable Call subdissector for retransmitted 802.11 frames, and Ignore vendor-specific HT elements to increase performance.
4.5.5. WEP and WPA1/2 Decryption
Wireshark is able to decrypt WEP and WPA1/2 captures. As shown in the Figure 55, we have to check Enable decryption and provide decryption keys. To do this, we can click on Edit... located to the right of Decryption keys.
To add a WEP key, let's select wep in the Key type, then fill in the Key field with the WEP key in hexadecimal. If it's helpful, we can separate each byte with a colon as shown in Figure 56.
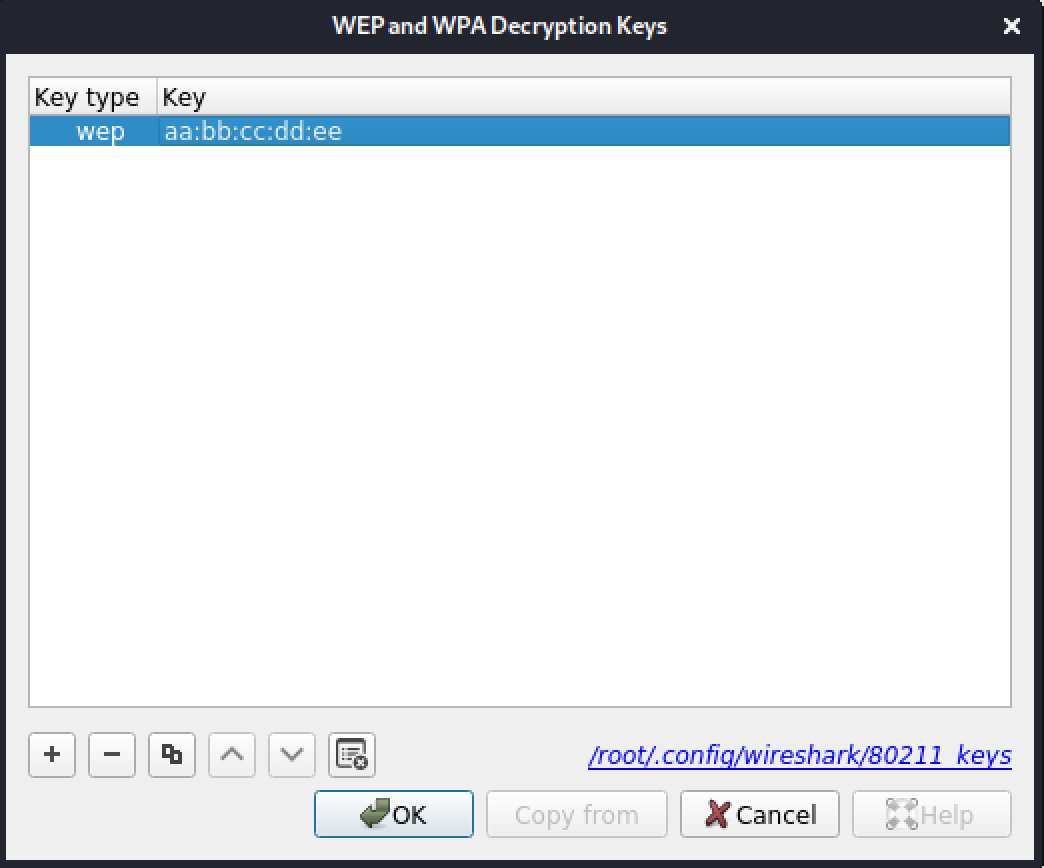
Figure 56: Adding a WEP key
The wpa-pwd is for WPA passphrases. The format is PASSPHRASE:ESSID.
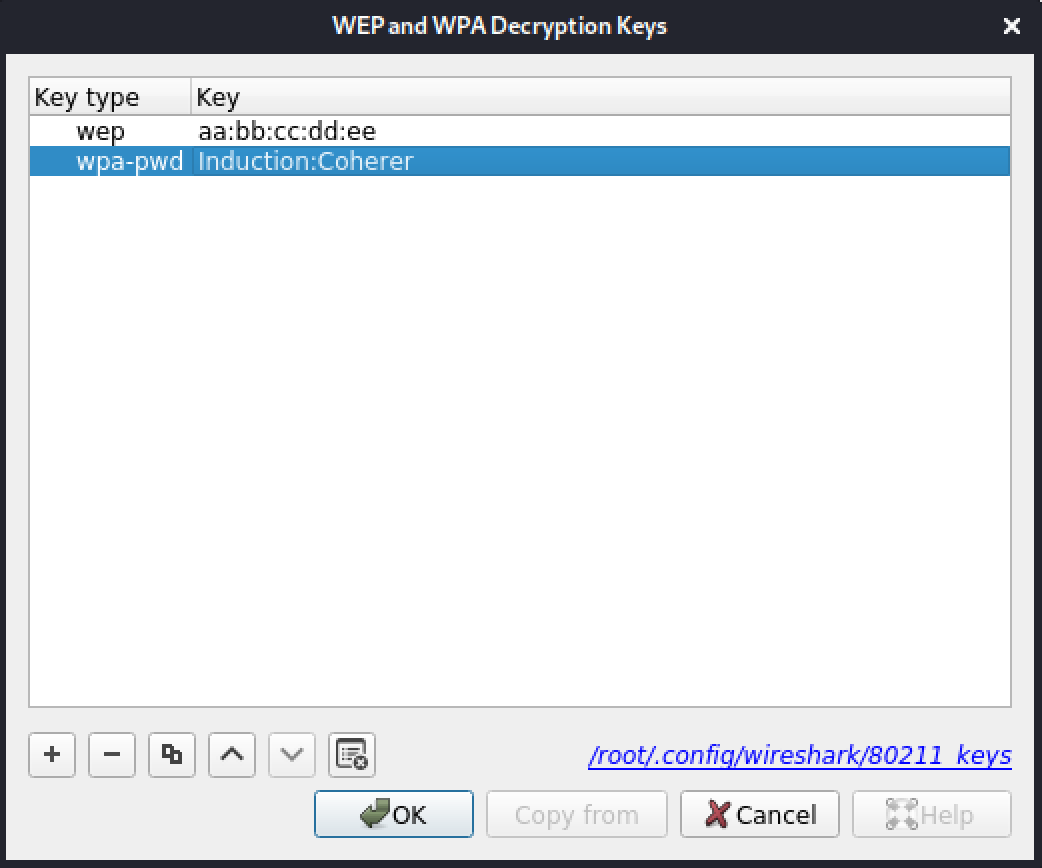
Figure 57: Adding a WPA PSK key with SSID
We can omit the ESSID and only specify the passphrase. In this case, Wireshark applies this passphrase to any network, using it along with the last found ESSID in the packet list.
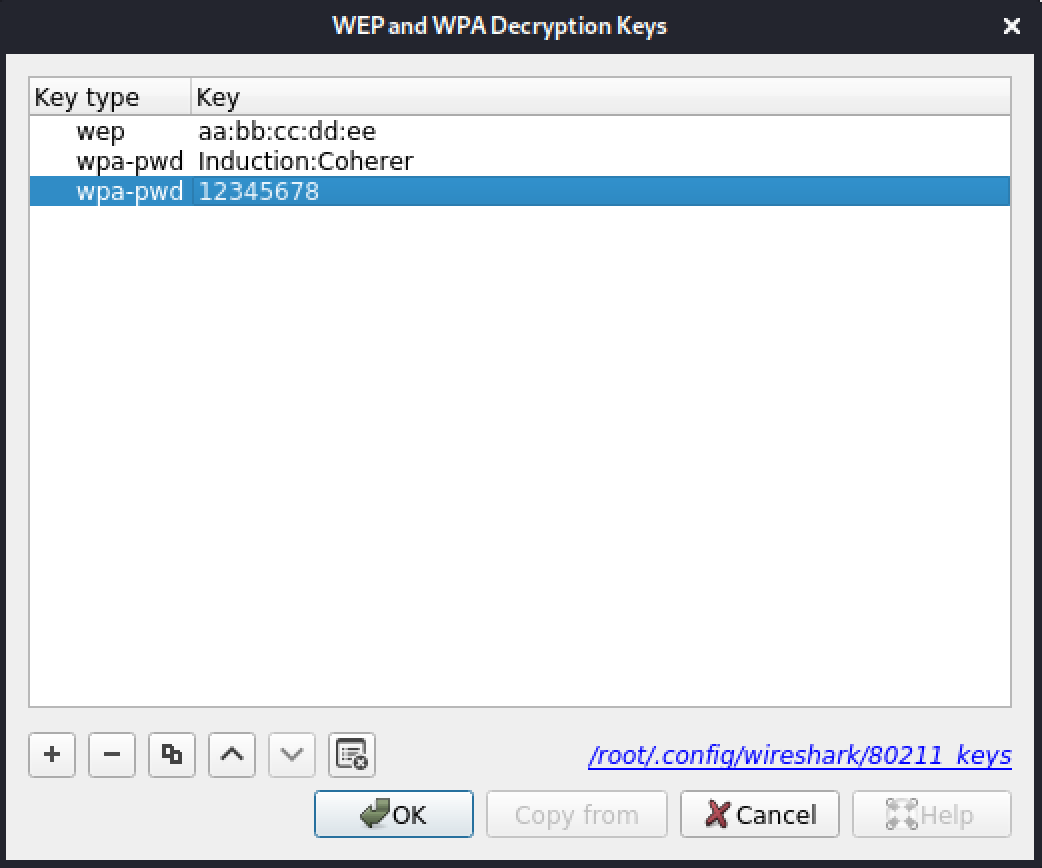
Figure 58: Adding a WPA PSK key without SSID
The last option, wpa-psk, allows us to enter the hexadecimal Pairwise Master Key (PMK). This is useful when decrypting WPA1/2 Enterprise packets, when using PSK and the ESSID, or when the passphrase contains a colon (:) character. We will discuss creating a PMK in the next section.
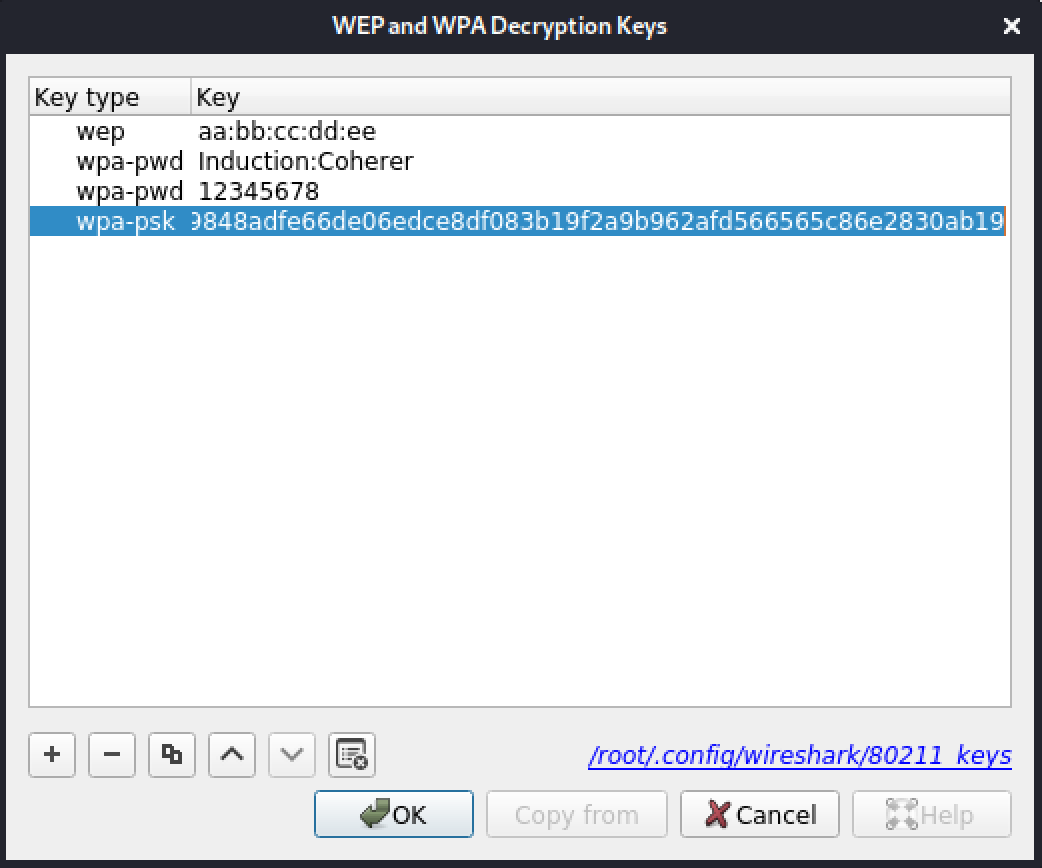
Figure 59: Adding a WPA PMK
To remove a key, we select it then click on the red X icon. The next icon allows us to duplicate an entry, and both arrows permit reordering. The last icon clears all the entries. To add a new key, we click on the + icon. Hovering the mouse over the Key column header displays of the formats of the keys, and, if the key is invalid, the Key type becomes red.
After adding the key(s), we can click OK and close preferences. Wireshark applies the keys to the packets and then decrypts them.
There are a few limitations to the decryption. First, due to how WPA/WPA2 was designed, we can only decrypt sessions after a full 4-way handshake. Second, Wireshark can usually handle up to 256 associations when decrypting WPA/WPA2, but it may fail if there are too many associations. Finally, the decrypted packets cannot be exported.
wpa_passphrase
wpa_passphrase1 is part of wpa_supplicant2 and we can use it to generate the PMK.3 It is meant to create a wpa_supplicant configuration file, but we are able to use it with Wireshark as well. It's fairly simple to use.
kali@kali:~$ wpa_passphrase
usage: wpa_passphrase <ssid> [passphrase]

If passphrase is left out, it will be read from stdin
Listing 25 - wpa_passphrase usage
The wpa_passphrase command requires one parameter, the SSID. The second parameter, a passphrase, is optional. If we don't provide a passphrase, it will prompt for user input. For security reasons, we don't recommend providing the passphrase as every command typed in a shell is saved in the history.
As an example, let's take the SSID "test" with the passphrase "abcdefg:".
kali@kali:~$ wpa_passphrase test abcdefg:
network={
    ssid="test"
    #psk="abcdefg:"
    psk=a1c425c0f4e5ff3746920c90cc55d17f4773512b6c1ed415526a3bcea3351b5b
}
Listing 26 - wpa_passphrase example usage
Now, we just need to add a new entry with a wpa-psk type key and copy the content of psk in the Key value. We do not want to provide an ESSID.
1 (die.net, 2007), https://linux.die.net/man/8/wpa_passphrase ↩︎
2 (Jouni Malinen, 2013), https://w1.fi/wpa_supplicant/ ↩︎
3 (Wikipedia, 2021), https://en.wikipedia.org/wiki/Pairwise_Master_Key#Protocol_operation ↩︎
4.5.6. WLAN Statistics
As the name suggests, WLAN Statistics displays an overview for all the wireless frames in the packet list. The information can be focused on certain packets or devices by using display filters.
We can see the statistics in Wireless > WLAN traffic. If we use wpa-Induction.pcap1 from the Wireshark sample files, these are the results that will be displayed.
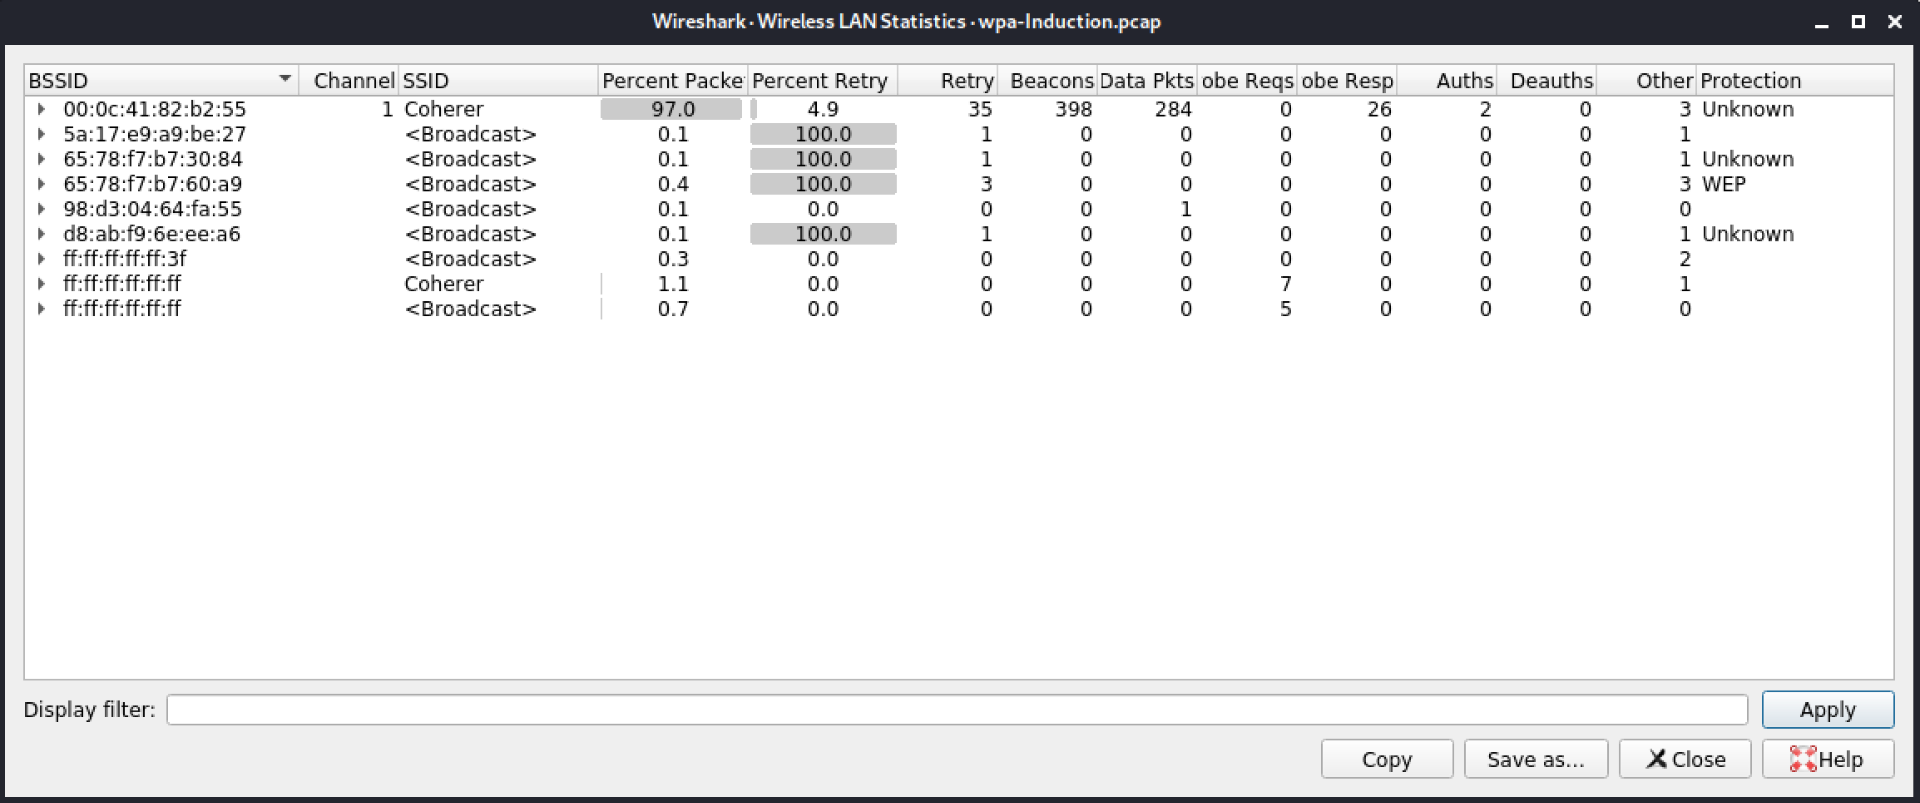
Figure 60: WLAN Statistics
We can use a display filter to focus the statistics using certain packets or devices. In the example below, we'll use the filter "wlan.bssid == 00:0c:41:82:b2:55" to focus on the Coherer SSID.
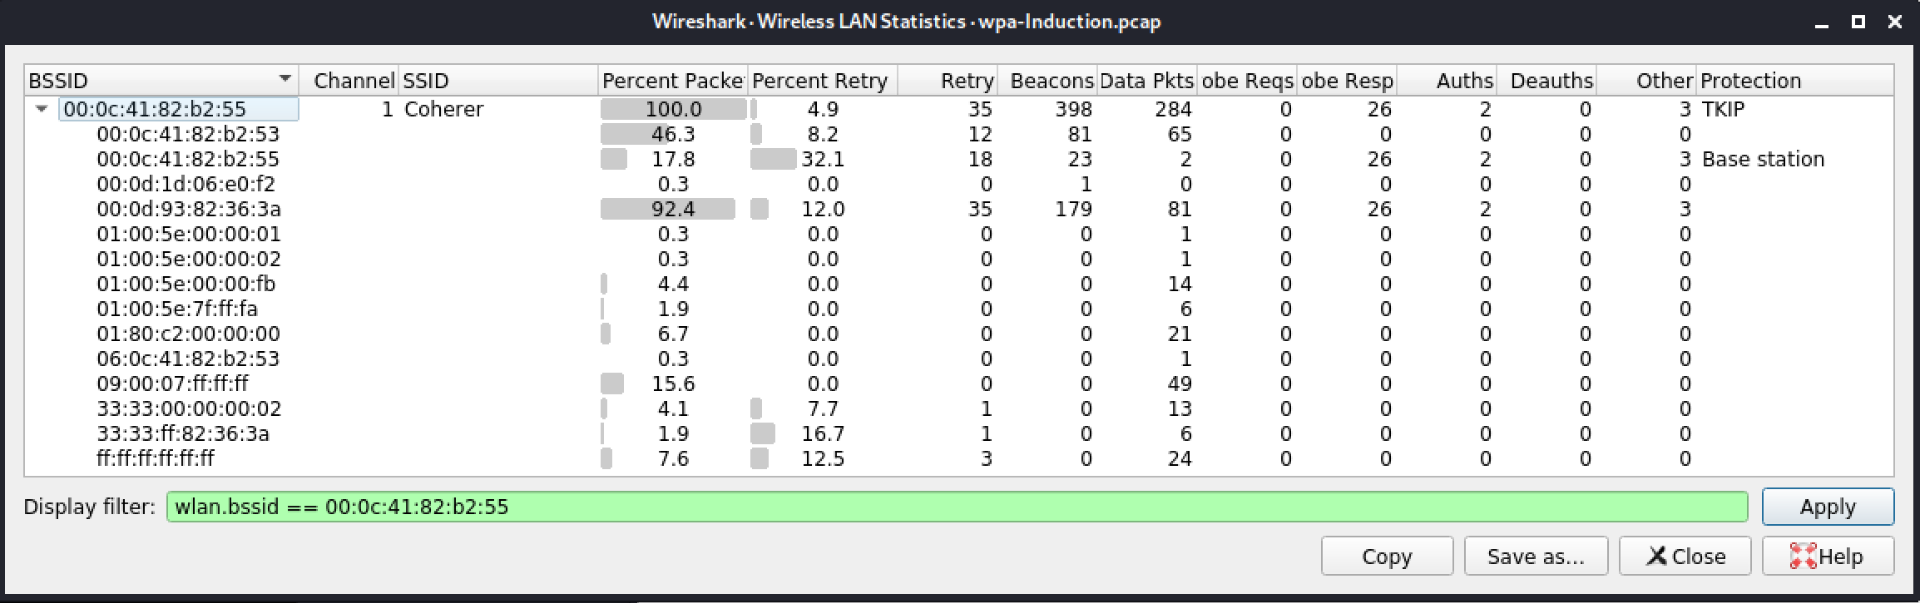
Figure 61: WLAN Statistics with display filter
Expanding the only BSSID left reveals all the MAC addresses linked to it. This will include the broadcast address and BSSID itself as indicated by the "Base station" in the last column.
We can export the summary can by clicking on Save as.... The resulting file contains the following.
==========================================================================================================================================
Wireless LAN Statistics - wpa-Induction.pcap:
BSSID  Channel  SSID  Percent Packets  Percent Retry  Retry  Beacons  Data Pkts  Probe Reqs  Probe Resp  Auths  Deauths  Other  Protection
------------------------------------------------------------------------------------------------------------------------------------------
00:0c:41:82:b2:55        1  Coherer       100.000000       4.908836     35      398        284           0          26      2        0      3  TKIP
------------------------------------------------------------------------------------------------------------------------------------------
Listing 27 - Content of the exported data from WLAN Statistics
Exercises
- Open wpa-Induction.pcap and enable coloring rules with the rules available in Wireshark's website. Locate and identify the authentication (pink), association (light blue and light green), and the four EAPoL (dark green) frames. All these frames should be close-by.
- Using display filters, use "eapol" to locate EAPoL frames and "wlan.fc.type_subtype in {0x0 0x1 0xb}" to locate association request/response and authentication frames.
- Add a column for the data rate, which can be found in the 802.11 radio information, and search for frames with a rate of 54 (Mbit).
- Set-up a WPA access point with a passphrase of your choice containing special characters. Start a packet capture and connect a device. Browse the web for a little while, then stop the capture.
- Use wpa_passphrase to generate the PMK, then add it in Wireshark to decrypt the capture. If all four EAPoL frames and beacons are present, DNS queries, HTTP, TLS, and other protocols should be displayed.
1 (Wireshark Foundation, 2020), https://wiki.wireshark.org/uploads/__moin_import__/attachments/SampleCaptures/wpa-Induction.pcap ↩︎
4.6. Wrapping Up
In this module, we started with basic 802.11 packet capture functionality in Wireshark. We covered the different ways to set-up remote packet capture, display and capture filters, as well as their differences and uses. Finally, we learned other 802.11-related features of Wireshark.